California knows how to avoid partisan gerrymandering
Overview
The redistricting season happens once every ten years, and it is always characterized by two things: fierce partisan struggles for control of the maps that will determine political power in the next decade, and anguished complaints about how politicized the process is. The current redistricting cycle is no different, featuring the usual allegations of partisan gerrymandering and consequent legal challenges to proposed district maps across the country. This boring-but-important topic receives less news coverage than it merits, and consequently it is rarely a target for major reforms. For example, a recent Pew poll found that most Americans are unaware of how districting is done in their state, suggesting this process happens largely out of public view.[1] In this article we explain that there is a solution to this once-a-decade nationwide battle: California’s model of an independent citizen redistricting commission.
Analysis
Why redistricting is important and how it works
All 50 states are subdivided into political districts, which are geographic areas that define the pools of voters who can select representatives to the state legislature and to Congress. Those districts are redrawn every decade using census data to adjust district boundary lines and account for population shifts. The two main issues in redistricting are partisan control and legislators choosing their voters.
Partisan control is problematic because party control over redistricting tends to maintain the existing balance of power. This is so in most of the country, because in most states the legislature controls redistricting. Majority parties typically draw districts to disadvantage the minority party, ensuring that the majority stays in power. Maintaining their advantage sometimes requires majority legislators to resort to drawing contorted districts, a tactic known as “gerrymandering.” The term comes from an 1812 Boston congressional district that resembled a salamander’s outline — it was called “Gerry’s salamander” after then-governor Elbridge Gerry and later shortened to gerrymander.
Legislators choosing their voters by drawing the political districts is a concern because it contributes to incumbency and to party power, and it undercuts popular control of representative government. Yet at first glance it’s not irrational to give legislatures this power. The practice of having a legislature draw its own districts flows naturally from separation of powers concerns. Like Congress, state legislatures typically have final say over their memberships. It’s obviously a bad idea to have the executive drawing legislative districts, and courts have similar incentives to stay out of the redistricting process. Faced with a choice between vesting redistricting power in the legislature, the executive, or the judiciary, most state constitution designers chose the legislature.
State legislative districts are often structured differently from congressional districts. The states — except for Nebraska — have two legislative chambers and redraw districts in both houses to achieve, at minimum, population-balanced districts, though other criteria may apply. The total number of legislative seats tends to be larger than the number of congressional seats. More than half of the legislative chambers in the states are larger than California’s congressional delegation.[2] Nine states also elect more than one representative from each district. The districts in Arizona, Idaho, New Jersey, North Dakota, and Washington, for example, are represented by one state senator and two state representatives. The New Hampshire state house has the largest legislative district (in terms of elected seats) in the country, which elects 11 members of the 400-seat chamber.[3] These characteristics make legislative redistricting more idiosyncratic than redrawing congressional districts. One important point of continuity between the congressional and legislative processes, however, is that in most states the same institutions draw both sets of district lines.[4]
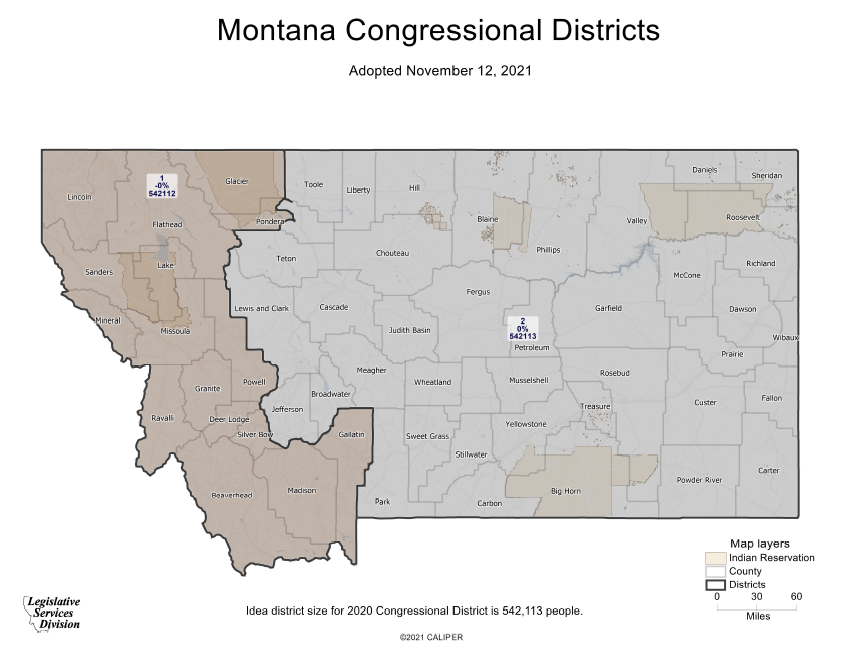
Montana, for example, has two congressional districts for national representatives, one in the west and one in the eastern part of the state:
Montana has a separate map overlay that shows the districts used for electing representatives to its state legislature:

These maps get redrawn every decade based on new population data from the census. The map-drawing process is complex: the authority in charge varies among the states, state and federal laws regulate the process, and judicial decisions also apply. But the bottom line is simple: the maps control which party’s candidates get elected, and that determines who governs in the statehouse or in Congress. That process is in play right now, with data from the 2020 census.
How redistricting is playing out nationally right now
The 2022 midterm elections will be the first contests drawn under new district lines based on 2020 census data. In this section we examine the finalized legislative plans thus far, apply one proposed standard for partisan gerrymandering to these maps, and discuss potential means for reducing bias in the future.
The key issue for any proposed map is whether it is fair: does it favor or disfavor one party? One metric for measuring fairness is a test in The Freedom to Vote Act (FTVA), a bill sponsored by Senator Amy Klobuchar and introduced in the Senate last year.[5] Its purpose is to determine whether a redistricting plan favors or disfavors any political party. The FTVA provides a test: a congressional plan has a “rebuttable presumption” of partisan bias if it would give one party at least 7% more seats than it would have won under a neutral plan based on the popular vote in the two previous presidential and U.S. senatorial elections.[6]
In the graphic below we apply the FTVA test to a set of 80 legislative plans. These results show that the legislative plans in 12 states, and the plan for one chamber in eight additional states, are biased to the point of triggering the FTVA’s protections against partisan gerrymandering. Thirty-three (41%) of these plans trigger the FTVA test of partisan bias in legislative districts.
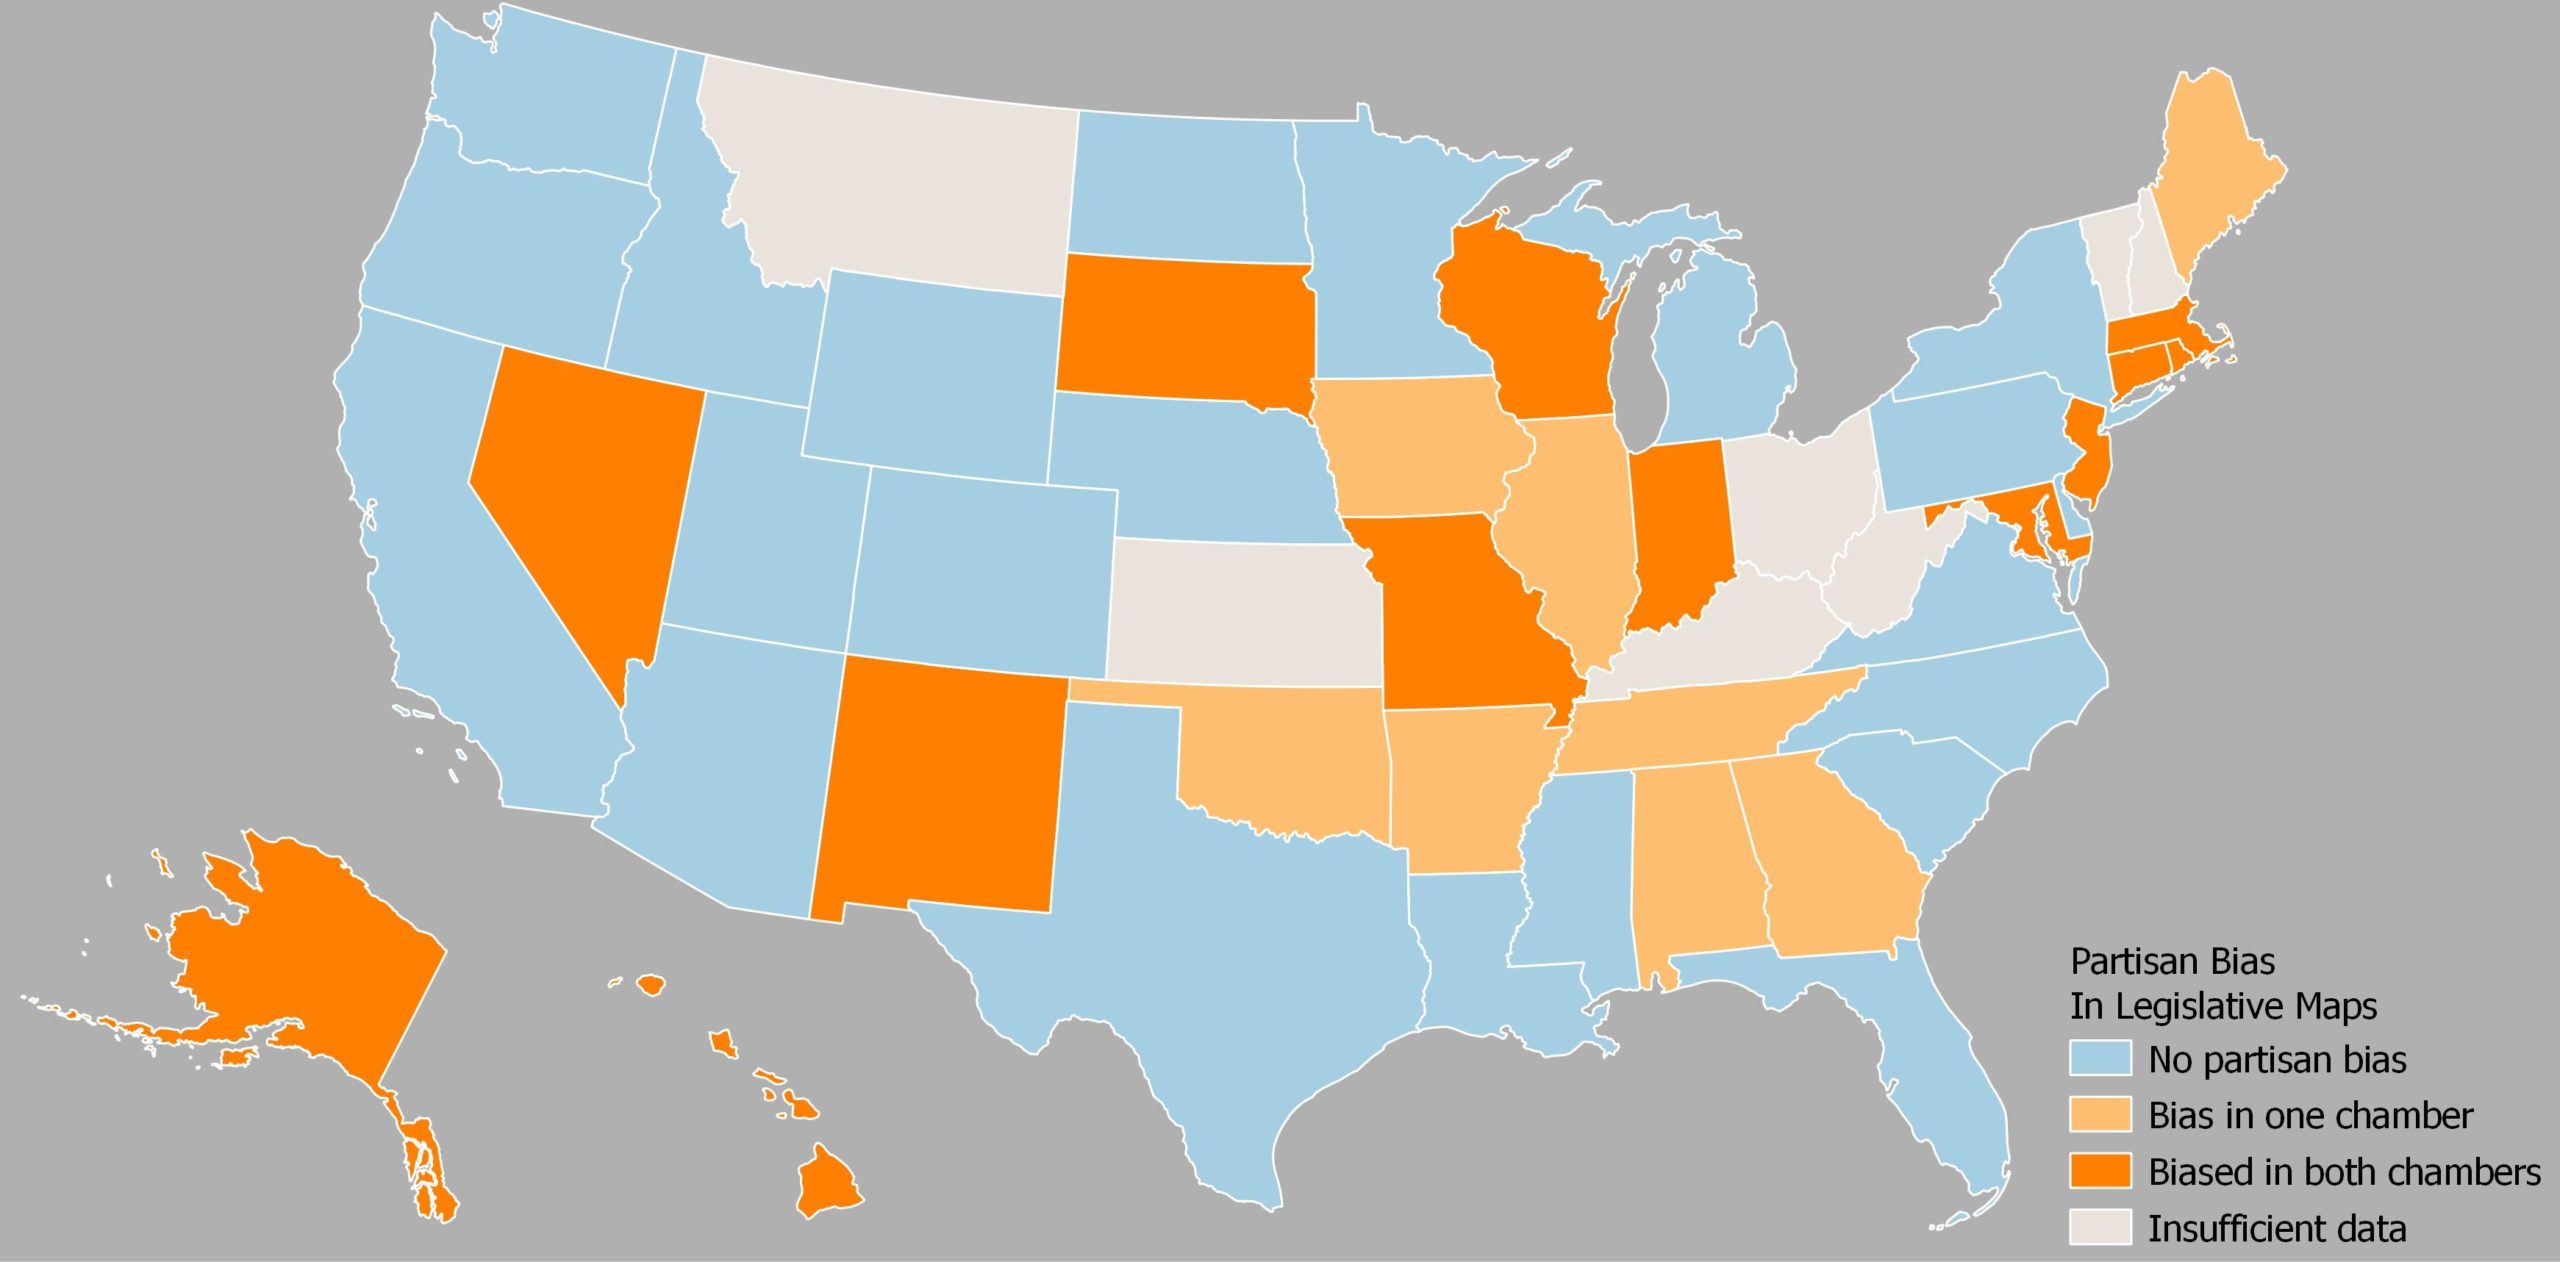
Categorizing the states by redistricting authority explains the distribution of biased maps: 41% of the plans drawn by state legislatures show bias. Note that courts are also imperfect in this context: the court-drawn plans in Minnesota and Virginia are fair by the FTVA test, while court-adopted maps in Wisconsin are biased. And note that the U.S. Supreme Court vacated the map chosen by the Wisconsin state supreme court on March 23; to be fair, our assessment is that every potential alternative plan in that state would trigger the FTVA’s presumption.[7]
The takeaway here is that independence from the legislature appears to be critical for drawing fair maps: 70% of the maps drawn by commissions whose members are politically appointed (Alaska, Hawaii, Idaho, Missouri, New Jersey, Pennsylvania, and Washington) advantage one party. By contrast, all the plans drawn by the independent commissions in Arizona, California, Colorado, and Michigan are neutral. This is empirical support for the policy preference we explain below for citizen commissions.
A caveat here is that the FTVA test we rely on may miss some partisan gerrymanders when the threshold for identifying bias is 7% of the seats in the chamber. This threshold can be quite large in some states. The Arkansas state house, for example, has 100 seats and thus the relevant threshold is seven seats. The new districts in Arkansas show an advantage for Republicans of between two and eight seats, depending on the reference election used — that is insufficient to trigger the FTVA presumption of bias.
Thus, the Arkansas house map could be called “fair enough,” but it appears to advantage one party over the other. The senate map, by contrast, has an obvious bias of about 15 seats in favor of Republicans. There are 19 additional cases of a map on the edge of being classified as a partisan gerrymander based on the threshold used, which would show about two-thirds of the legislative maps in the country are biased if those are counted along with the 33 cases where the bias appears to be present under any plausible threshold for detection.
Whether the 7% threshold used to detect partisan gerrymandering at the congressional level is appropriate for legislative districts is a matter for debate.[8] Consider that the congressional threshold becomes controlling only in states with more than 14 districts; in smaller states the threshold is 1 seat. There are no legislative chambers with 14 or fewer members. The smallest legislative chamber is the Alaska Senate with 20 districts. If we adopt a threshold relative to the total size of the legislative chambers and (for example) treat the smallest quartile of chambers differently, then we should establish a fixed standard for detecting partisan gerrymanders for chambers with 38 or fewer members (the current size of the Texas congressional delegation, for reference) and a floating standard for larger chambers. This suggests using a more stringent standard for detecting partisan bias in legislative chambers, although the optimal limit for identifying partisan gerrymandering in legislatures remains elusive.
There are four instances of counter-intuitive results of the FTVA test. The maps in the Maryland house and senate, the Oklahoma house, and the Hawaii senate are biased, but in favor of the minority party. The explanation reveals a peculiarity of how we measure partisan bias. Recall that the efficiency gap measures “wasted votes” to determine the direction of bias. When one party wins with extraordinarily large majorities, that can reverse the direction of bias. In the Maryland senate map, for example, there are 13 districts where the Democratic candidate is expected to win more than 5 times the number of votes won by the Republican candidate. The result is that Democrats end up wasting many more votes than Republicans because of these excessively large majorities. The efficiency gap analysis in this case tilts toward Republicans even if the map itself returns more Democratic seats.
Despite the lack of attention from the public, legislative districting is consequential for policymaking in the states and for identifying the party likely to control the next redistricting cycle in 2030. Applying the FTVA test for partisan bias to legislative plans shows partisan gerrymandering is widespread in state-level maps. The California model of redistricting independent from the legislature, however, can produce fair maps.
California’s citizen redistricting commission
The independent citizen redistricting commission model employed in a handful of states is the best solution to the fair redistricting problem. In California, for example, the Citizens Redistricting Commission (established by Proposition 11 in 2008) reassigned the redistricting power from the legislature to a group of 14 citizens of various political affiliations. The California commission is tasked with drawing fair maps for 52 congressional districts and the state legislature. Its first district maps took effect in the June 2012 primary elections. When those maps were challenged, the California Supreme Court unanimously upheld them.[9]
The maps produced by California’s citizen commission from the 2020 census have received zero legal challenges. Consistent with census data showing increased Latino population in California, the commission’s new maps increased the number of Latino majority districts from 10 to 16, making the number of Latino seats roughly proportional to the state’s Latino population.[10] This was done while maintaining districts that allow for strong representation for Asian American and Black communities.
The California redistricting commission credits two factors for its success in achieving fairness: community outreach and engagement, and fidelity to a fair process.
Part of the commission’s mandate is to have an open and transparent process that engages Californians by conducting community outreach and collecting testimony on communities of interest, defined by law as a contiguous “population that shares common social or economic interests that should be included within a single supervisorial district for purposes of its effective and fair representation.”[11]
The ongoing COVID-19 pandemic has shown that community engagement is possible under even the most challenging circumstances. The commission conducted all meetings virtually for over a year, as public safety concerns prevented travel and meeting with communities. Indeed, remote meetings may have increased public access by reducing participation costs. In collaboration with the Statewide Database, held at the U.C. Berkeley School of Law, the commission offered a host of online mapping tools that communities could use to submit their testimony. As lines were being drawn, community members could submit their comments on a constantly-updated online platform, and as the commission advanced new map drafts they were uploaded into an interactive map tool that communities could download. In another pandemic reversal, the delayed release of the census data used for redistricting proved beneficial by providing more time for community engagement.
The commission’s commitment to a fair and transparent process flowed from the California constitution, which requires that the commission conduct an “open and transparent process” and that commissioners should conduct themselves with “integrity and fairness.”[12] Commissioners took this mandate to heart treating one another with civility, ensuring that meetings were open and accessible, and that the public had every opportunity to weigh in on the maps.
The commission’s authorizing act defined ranked criteria it was required to use in the redistricting process, including equal population, compliance with the federal voting rights act, respect for county and city boundaries, and communities of interest. Following those criteria required careful consideration of data, review of the more than 40,000 public testimony submissions, careful deliberation, and some trial and error.
Figure 1: Constitutionally Mandated Line Drawing Criteria for the California Citizens Redistricting Commission
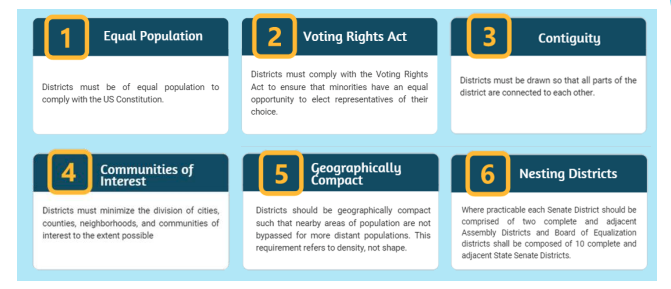
Source: California Citizens Redistricting Commission, “Redistricting Basics Presentation”
The California redistricting commission shares with the courts a duty to be as impartial and fair as possible — but unlike judges presiding over legal issues the redistricting process is an inherently political one. That made the commission a target for many interests. There was a clear bitterness from many who were vocal that they should have the power to redistrict. Unlike the legislators who used to draw the maps, the commission was duty-bound to resist lobbying attempts from interest groups and stakeholders. In any event, rather than dividing the commission, the criticism inspired unity and renewed dedication to producing an unimpeachably fair map.
Conclusion
The problem with redistricting has always been where to vest control. The executive is ruled out because that could lead to a captive legislature and a dictatorship. The courts are a poor choice, because the process involves political and policy decisions that are beyond the judicial function.[13] Nor do the courts seek this work; before California’s electorate created its citizen redistricting commission, the California Supreme Court involved itself in redistricting only when necessary.[14] Leaving it with the legislature, as most states do, guarantees decennial partisan battles for control of the maps that will determine political power in the next decade, and anguished hand-wringing about how politicized the process is.
The solution is an independent citizen commission, which as the states with such commissions show is the process most likely to produce fair maps. Unfortunately, another truism is relevant here: those with power do not give it up willingly. It is not a coincidence that most states with independent commissions have the initiative power in their state constitutions. Redistricting likely will remain an intractable political problem for state legislatures — until the voters solve it themselves.
—o0o—
Dr. Peter Miller is a researcher at the Brennan Center focusing on redistricting, voting, and elections. Anna Harris is a master’s student in the Wagner School at NYU and a Parke Fellow at the Brennan Center for Justice. Dr. Sara Sadhwani is a commissioner on the California Citizens Redistricting Commission and an assistant professor of politics at Pomona College.
-
Jones, With Legislative Redistricting at a Crucial Stage, Most Americans Don’t Feel Strongly About It, Pew Research Center (Mar. 4, 2022). ↑
-
California elected 53 members of the U.S. House between 2012 and 2020. The state will elect 52 members of the U.S. House in 2022. For the size of state legislatures, see National Conference of State Legislatures, Changes in the Sizes of Legislatures 1960-2021 (April 19, 2021). ↑
-
The district plan for the New Hampshire house in place between 2012 and 2020 divided the 400 seats in the chamber between 204 districts (including floterial districts), with an average of 1.96 seats elected per district. Of these 204 districts, 105 districts elected a single representative and 99 elected between 2 and 11 representatives. Of these 99 multimember districts, 53 elected two representatives and 1 district, the Hillsborough 37th, elected 11 members of the state house. See WMUR New Hampshire State House 2020 general election results (December 3, 2020). The ratio of residents to representatives in this district is about 3,601 persons per state representative when using the 2020 census figures. The ratio of representation in New Hampshire remains the lowest in state legislatures. See National Conference of State Legislatures 2010 Redistricting Deviation Table (January 15, 2020). ↑
-
Brennan Center, Who Draws the Maps? Legislative and Congressional Redistricting (Jan. 30, 2019). ↑
-
See Sen. No. 2747, 117th Cong., 1st Sess., tit. V (2021). By its terms, the FTVA would have applied only to congressional maps, but its standards are also helpful when looking at legislative maps. ↑
-
For more detail on this point see Miller & Harris, Sen. Manchin’s Freedom to Vote Act Would Help Stop Gerrymandering, Our Research Finds, Washington Post (Jan. 10, 2022) (identifying bias in congressional plans using the “efficiency gap,” which measures the rate of “wasted ballots” that do not alter the result of the election for either major party). ↑
-
Wis. Leg. v. Wis. Elec. Com. (Mar. 23, 2022, No. 21A471) 595 U.S. __. ↑
-
The essential problem lies in how to operationalize a standard of partisan fairness. Section 6 of the Michigan constitution, for example, includes the criterion that districts drawn by the independent redistricting commission “shall not provide a disproportionate advantage to any political party. A disproportionate advantage shall be determined using accepted measures of partisan fairness.” Mich. Const., art. IV, § 6, subd. 13(d). The North Carolina Supreme Court in Harper v. Hall found “it is entirely workable to consider the seven percent efficiency gap threshold as a presumption of constitutionality, such that absent other evidence, any plan falling within that limit is presumptively constitutional.” Harper v. Hall (N.C. 2022, No. 413PA21) at ¶ 167. The Wisconsin supreme court, by contrast, opted to decline to use any threshold to determine if a legislative plan there constitutes a partisan gerrymander in litigation related to the 2020 redistricting proposals. “The United States Supreme Court recently declared there are no legal standards by which judges may decide whether maps are politically ‘fair.’ . . . We agree.” Johnson v. Wis. Elec. Com. (Wis. 2021, No. 2021AP1450-OA) at ¶ 3. ↑
-
See Vandermost v. Bowen (2012) 53 Cal.4th 421. A federal court challenge also failed, as did a referendum challenge to the maps (Proposition 40 in November 2012). For now, questions about the commission’s underlying validity appear to be settled, and the apportionment battle has shifted once again. ↑
-
McGhee & Paluch, Racial Representation and Partisan Leanings in California’s Final Redistricting Maps, PPIC (Jan. 12, 2022). ↑
-
Cal. Elec. Code § 21500(c)(2). ↑
-
Cal. Const., art. XXI, § 2(b). ↑
-
Vesting the courts with redistricting power had its chance in California: Proposition 39 in 1984 would have amended the state constitution to establish a redistricting commission composed of eight former appellate court justices. It lost at the ballot. ↑
-
See Silver v. Brown (1965) 63 Cal.2d 270; Legislature v. Reinecke (1973) 10 Cal.3d 396; Assembly v. Deukmejian (1982) 30 Cal.3d 638; Wilson v. Eu (1991) 54 Cal.3d 471. ↑


