SCOCA is taking longer to decide its cases


Overview
The California Supreme Court is taking longer to issue fewer opinions compared with its past performance. In the 2022 review we showed that over the past 24 years the court’s unanimity rate steadily increased, while its opinion output steadily declined. In today’s study of the same period we examine how long the court takes to produce an opinion, measured by the time from the last reply brief being filed to the case being ordered on calendar for argument. The results show that this value has increased over time. Combined, the three data points suggest that over the past 24 years the court is taking longer to decide fewer cases, but its decisions are made with greater unanimity.
Analysis
Methodology
We conducted a study to answer the question we identified and left unresolved in the 2022 year-in-review article: “The court could be spending more time on its internal drafting process. Longer lead times to oral argument as the court devotes more effort to critiquing its work-in-progress draft majority opinion could drive down opinion output. As noted above, this requires an empirical study to determine whether it’s taking longer to produce opinion drafts.”
Deciding cases incorporates two processes: the time it takes for a chambers to draft an opinion, and the time it takes for the other chambers to review that draft and express their views, collectively described here as opinion production. To evaluate how long the court’s opinion production process takes, from the California Constitution Center’s existing SCOCA opinions dataset we pulled all merits opinions issued from January 1998 through December 2022. We grouped cases according to their citation year. From the court’s online docket for each case we tabulated a series of dates, as available: fully briefed, warning letter, ordered on calendar, last brief to warning letter, warning letter to ordered on calendar, and last brief filed to ordered on calendar.[1] We calculated in days the last brief filed to ordered on calendar value for each case. We calculated the per-year average, median, and standard deviation for the whole 1998–2022 study period, and compared 1998–2016 with 2017–2022 to highlight the effect of a 2015 policy change.
In 2015 the court changed its grant-and-hold policy.[2] Stated generally, under the new policy all cases (regardless of their publication status) in a group of related petitions are granted review, one lead case is decided by opinion, and that one opinion applies to all the related cases. The old procedure was to deny petitions for review of unpublished cases that raised the same issue as a lead case. The new procedure is to instead grant review to all related cases and hold them for action after the lead case is decided by opinion.[3]
Coincidentally with that internal policy change, around the end of 2016 another procedure changed: before then, the court issued argument warning letters only for capital cases, but from 2017 to the present the court began issuing warning letters in all cases. This change required us to focus on last brief filed to ordered on calendar as the best value for consistently measuring how long the court’s opinion production process takes across the whole period. But that may in any event be the proper focus for this study because of the 90-day rule.[4]
The 90-day rule applied throughout the study period, resulting in a consistent practice by the court of generally ordering cases to argument only when a draft opinion with at least four votes was ready. (Insiders will call this the calendar memo.) This means that last brief filed to ordered on calendar best measures how long the court spends on opinion-drafting and internal review: it generally will not start drafting until briefing is complete, and it generally will not order argument until that drafting and related internal review by all other chambers is complete. It doubtless is routine that draft opinions are revised after argument; even so, that work must always occur within 90 days, so every case has at most a zero-to-90-days variance at the end (leaving aside the rare reargument scenario). Thus, the last brief filed to ordered on calendar value captures the bulk of the court’s opinion production time in most cases, making it the most consistent and accurate measurement of how long it takes the court to write a given opinion.
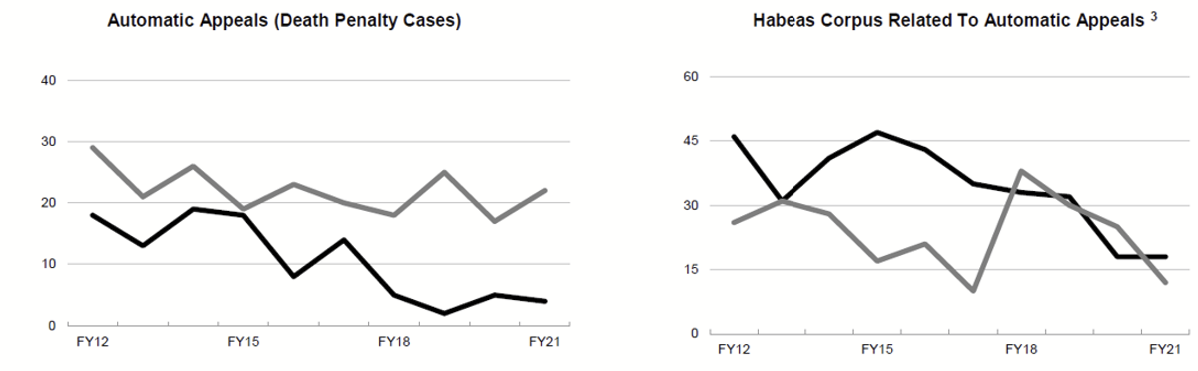
We considered whether the composition of the court’s docket changed during the study period; if for example a high-effort category such as capital cases rose or fell substantially over time that could explain much about both the average time to decision and the opinion output. But the annual Judicial Council reports suggest that the rough proportions of the case types are unchanged over time. General civil and criminal cases are mostly flat, suggesting that their individual quantities and relative proportions are consistent enough to be discounted. The one category that shows significant change over time is automatic capital appeals — but as Figure 1 shows, the trend is downward. This is counterintuitive: fewer capital cases should free up the court’s resources and result in greater activity at greater speed on other matters. That mystery aside, nothing suggests that changes in the case types or quantities are factors in the court’s opinion output or opinion-writing pace.
Finally, in the approximately 2,300 cases in this study there are exceptions: the case summarily reversed in short order by per curiam order, the very complex capital case, the reargued matter, and so on. As the graphs below show, there are indeed some outliers. Over time as those outliers become more common their impact on the results increases: the increasingly longer average time stems from more of these extreme values. And as outliers become more common they stop looking like discountable rarities and more like part of the regular course of events.
Summary of conclusions
Our dataset shows a significant increase over time in the last brief filed to ordered on calendar value, both overall and comparatively. Each of the bulleted points supports the conclusion that it is taking longer for the court to produce opinions:
- The annual average of the time last brief filed to ordered on calendar value increases over time, with a significant change in pace after the 2015 policy change.
- The period average of the time last brief filed to ordered on calendar value for 1998–2015 is measurably lower than the overall average of that value, while the period average for 2016–22 is much higher than the value’s overall average. This is particularly striking given that the sub-periods before and after the policy change are of unequal duration.
- The standard deviation of the time last brief filed to ordered on calendar value increases steadily, with a marked spike after 2016, showing that the variance in how long opinion production takes increases over time and particularly following the policy change.
- Of the top 10 largest time last brief filed to ordered on calendar values in the top 10% in the period, 18 of the 25 are in 2016 or after. That’s 72% of the slice — nearly three-quarters of the longest-duration cases followed the policy change.
- A pivot table shows inverted results for the two sub-periods: there are more and more-consistently occurring shorter-duration events in 1998–2015, and more and more-consistently occurring longer-duration events in 2016–22.
The 2022 review showed that over the past 24 years the court’s unanimity rate steadily increased. In the Chief Justice George era the overall average unanimity rate was 51.43%, and in the time of Chief Justice Cantil-Sakauye it was 71.90%. The 2022 review also charted the steady decline in the court’s opinion output over that period. In 1998–2010 the average annual opinions is 106.46, and in 2011–22 the average is 76.33. Those results, combined with this study’s results, show that over the past 24 years the court is taking longer to decide fewer cases with increasing unanimity.
The caveat to these conclusions is that although this study shows significant recent changes, in context they may be less significant. We discussed some possible explanations in the 2022 review; for example, the pandemic could be a factor. These environmental variables suggest caution in overstating the trend identified here or what it means. Yet we do see a trend, and it extends long before the pandemic, with the exception of a few years where there was over- or under-production. So be aware of this study’s limits and the possible effects of unaccounted-for factors.
Detailed data analysis
Figure 2 shows the whole-period change in the annual average and median time last brief filed to ordered on calendar value.
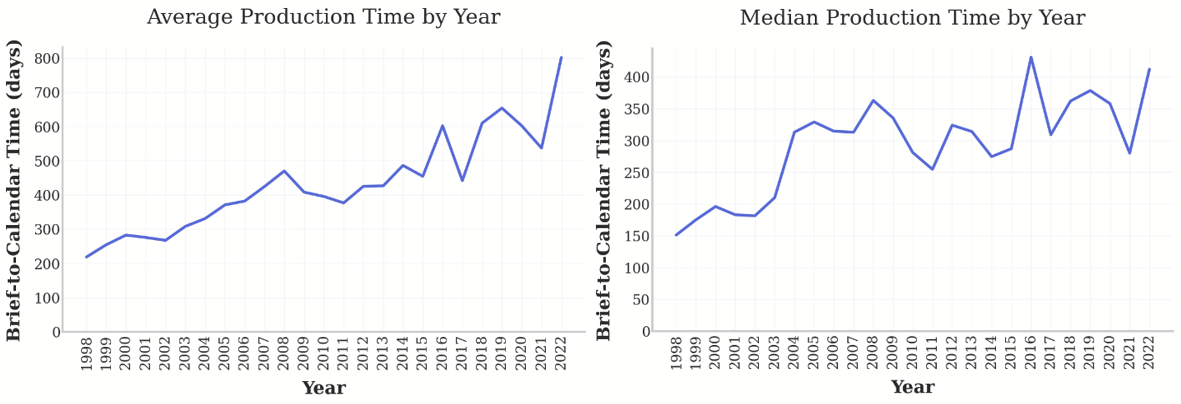
Both show steady increases in time, with a significant event around 2016 (immediately after the 2015 policy change), after which the average increases to its highest-ever levels. These graphs show that it is taking the court longer, on average, year-over-year, to produce opinions. A potential counterpoint is that although the mean is gradually increasing, the median does not show a clear trend after 2004. And even if the median is increasing, it is doing so at a much slower rate (the mean is increasing faster than the median). This may be caused by the increase in extreme values (the increase in standard deviation), which we turn to now.
Figure 3 shows the whole-period change in standard deviation and overlays the annual averages with standard deviation error bars to show the data range for each year.
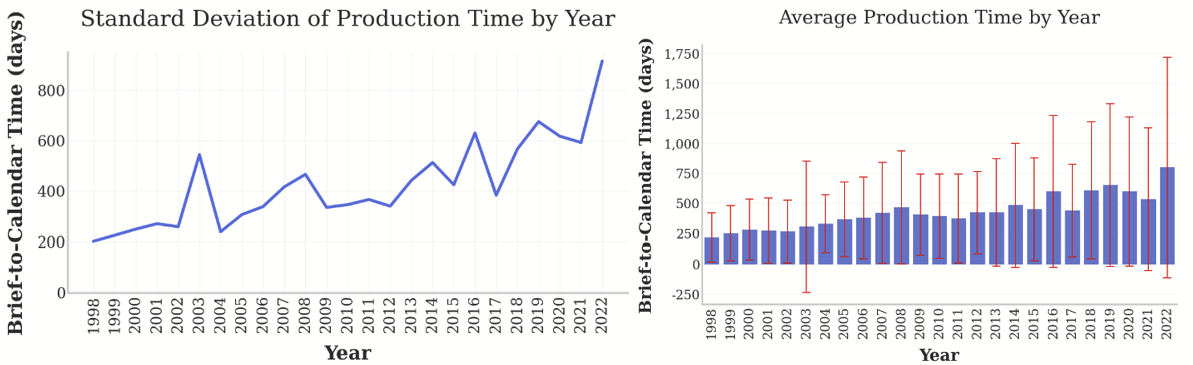
The standard deviation measures the variation or dispersion of the dataset. A low standard deviation indicates that the values tend to be close to the mean, and a high standard deviation indicates that the values are more dispersed over a wider range.[5] The fact that the standard deviation increases over time in this dataset, with its spike after 2015, shows that the range of possible days for completing a draft opinion and its internal review increases over time, with a value farther from the mean becoming more likely.
Figure 3 suggests that the court’s workflow is becoming less consistent over time: in earlier years the court more consistently produced opinions in a relatively shorter time and smaller possible time range, and conversely in later years the court more consistently took relatively longer to produce opinions with a larger possible time range.
To illustrate this, in Figure 4 we broke the dataset into three periods to compare their average time last brief filed to ordered on calendar value: overall, 1998–2015, and 2016–22. This shows that the 1998–2015 average time last brief filed to ordered on calendar value is lower than the overall average for that value, and conversely that the 2016–22 average for that value is higher than the overall average.
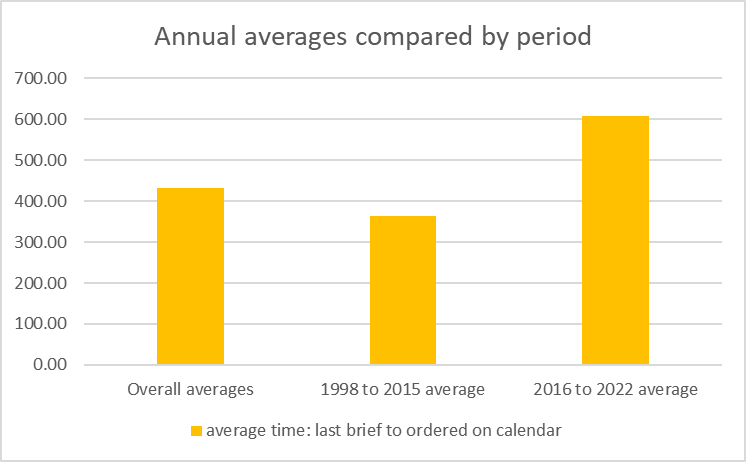
Comparing 1998–2015 with 2016–2022, the difference in the averages is 218.2 days. Based on a simple T-test, the null hypothesis of equal means is rejected (t = 7.412; p < 0.001); in other words, there is a statistically significant difference in the means before and after the 2015 policy change.[6] There is a low likelihood that the observed difference in means is due only to random variation between populations with unequal means.
Figure 5 shows the change over time of the annual percentage of cases above-or-below the overall average.
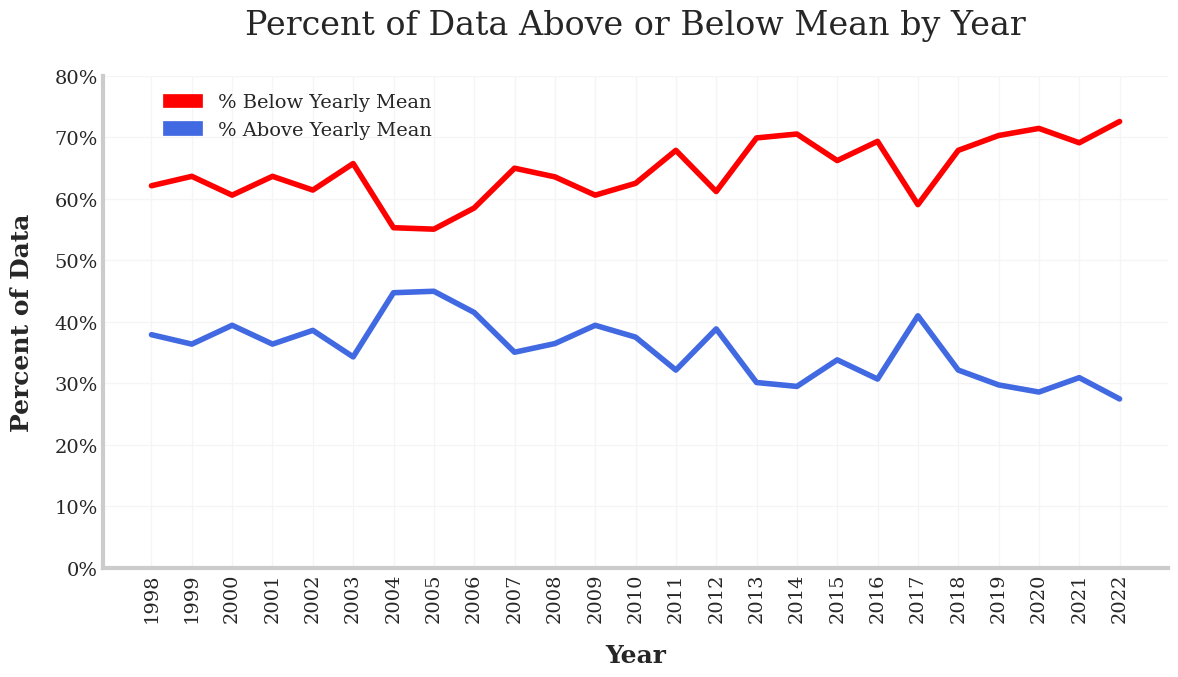
These trends suggest that over time there are fewer values above the average, but those that are above the average are far above the average. This contributes to our view that outliers in this time value become more impactful over time.
Figure 6 depicts the top 10% largest values of each year.

In this figure the top 10 largest values per year each get separate colors. It shows that the longest duration values in a given year increase over time, with most of the highest values occurring after 2015. To illustrate that, we highlighted the top 10% of this slice, and found that 18 of the 25 are in or after 2016. That’s 72% — nearly three-quarters of the longest-duration cases in the whole dataset are after the 2015 policy change. This is consistent with Figure 3 above (the standard deviation change graph) because both show that a larger time last brief filed to ordered on calendar value and a greater deviation from the mean occur more frequently over time, and particularly after the 2015 policy change.
We graphed each year in the study period as a histogram. A histogram is a frequency data analysis tool, which sorts data into groupings (called bins) in a visual graph similar to a bar chart. Histograms show how often something occurs in a dataset and how often results fall within certain boundaries. Figure 7 is the histograms for the first and last years of the study period.
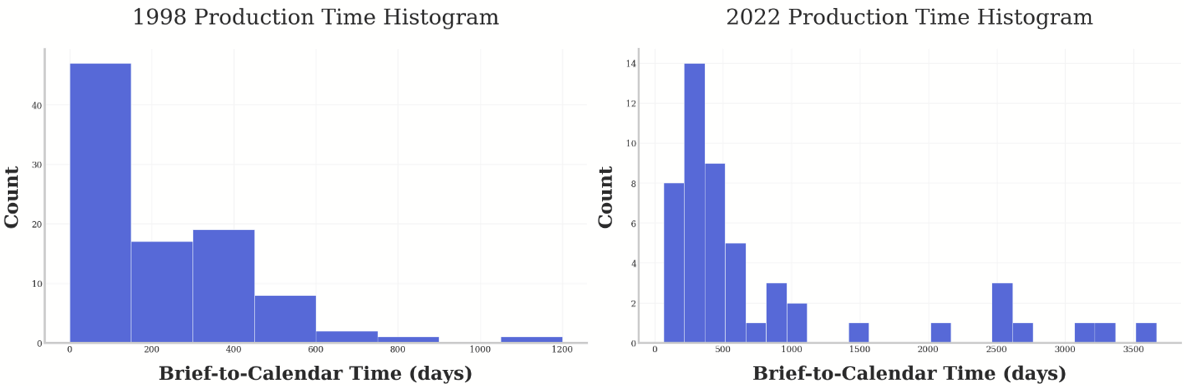
These histograms group the time last brief filed to ordered on calendar value for a given year into bins according to frequency of occurrence. Due to the software used to generate these histograms, smaller and fewer bins indicate more consistent values; larger and more bins indicate more-variable data. The 1998 histogram shows comparatively more cases grouped into fewer bins, and a smaller overall range of values. The 2022 histogram shows a comparatively wider spread of values into more bins, and a larger overall value range.
This shows that in general the opinion production time in 1998 was shorter and more consistent than the opinion production time in 2022. Using the first and last years is arguably an extreme example, but it does highlight the disparity between earlier versus later years in the study period. Viewing all 24 histograms (as we did) would only show the gradual progression of the histograms from a 1998 result to a 2022 result.
Figure 8 is a pivot table of the time last brief filed to ordered on calendar value for each year in the study period. Years before the 2015 policy change are all colored blue; following years are all colored red. A pivot table will highlight patterns in the overall dataset by aggregating similar results — here, higher results in a given range of days means that more values occurred in that range.
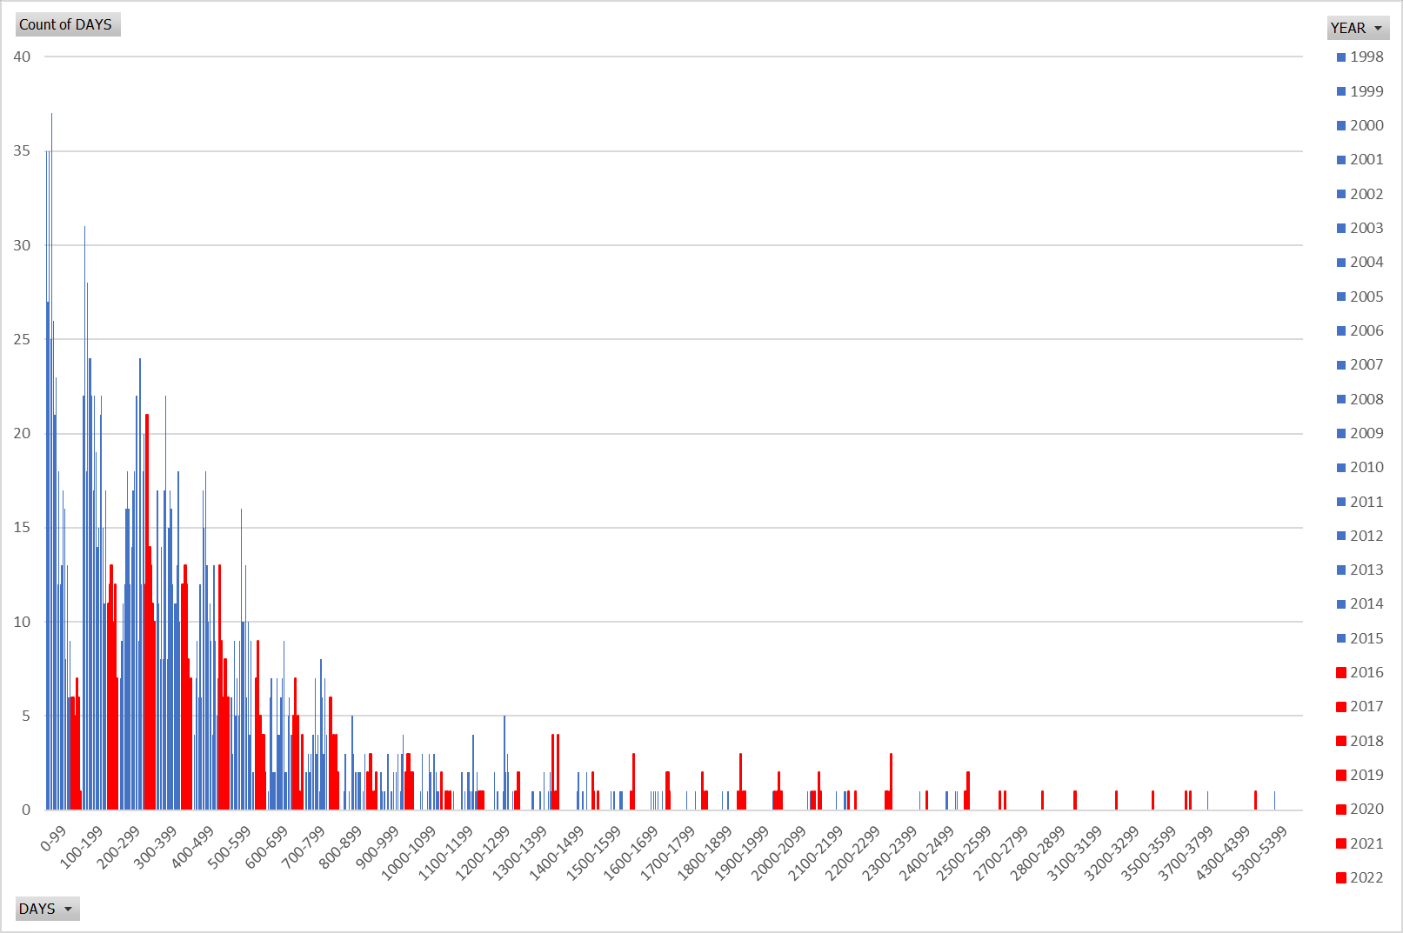
This shows that more and shorter day-count values occurred most frequently in the pre-2016 part of the study, and more and longer day-count values occurred more frequently after the policy change. And it shows that before the policy change the court’s opinion production time is tightly grouped, while the post-policy-change process is less consistent with non-outlier values spread over a much larger possible day-count field.
Figure 9 is the reverse of Figure 8: it shows the incidence of durations by year. Each dot is a time last brief filed to ordered on calendar value in a given year, with higher results showing longer time values occurring more frequently (outliers above 5500 days are omitted).
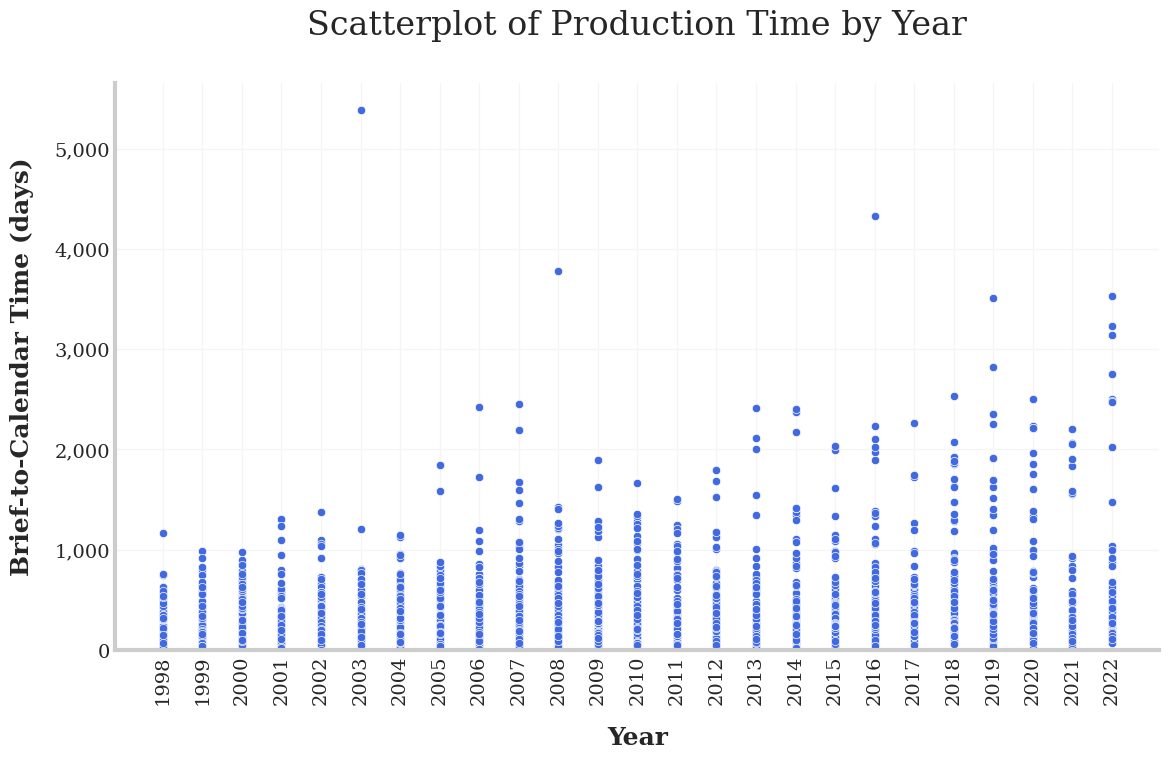
This shows the inverse of Figure 8, with a clear pattern of longer day-counts consistently occurring later in the study period, and a reverse pattern of shorter day-counts and a tight grouping of those counts in the early years.
Finally, Figure 10 is a box plot, which measures the spread in the data and shows whether significant variation exists in the range or if it is concentrated around the median. It divides the data into four quartiles: the main box is drawn between the first and third quartiles, with a midline marking the median. The vertical width of the box describes the most concentrated area of the data distribution, and the whiskers show the minimum and maximum values that are outside the first and third quartiles.[7] This box plot is colored as the pivot table in Figure 8 is: before the policy change in blue, after in red. Each box is one year, time progressing to the right.
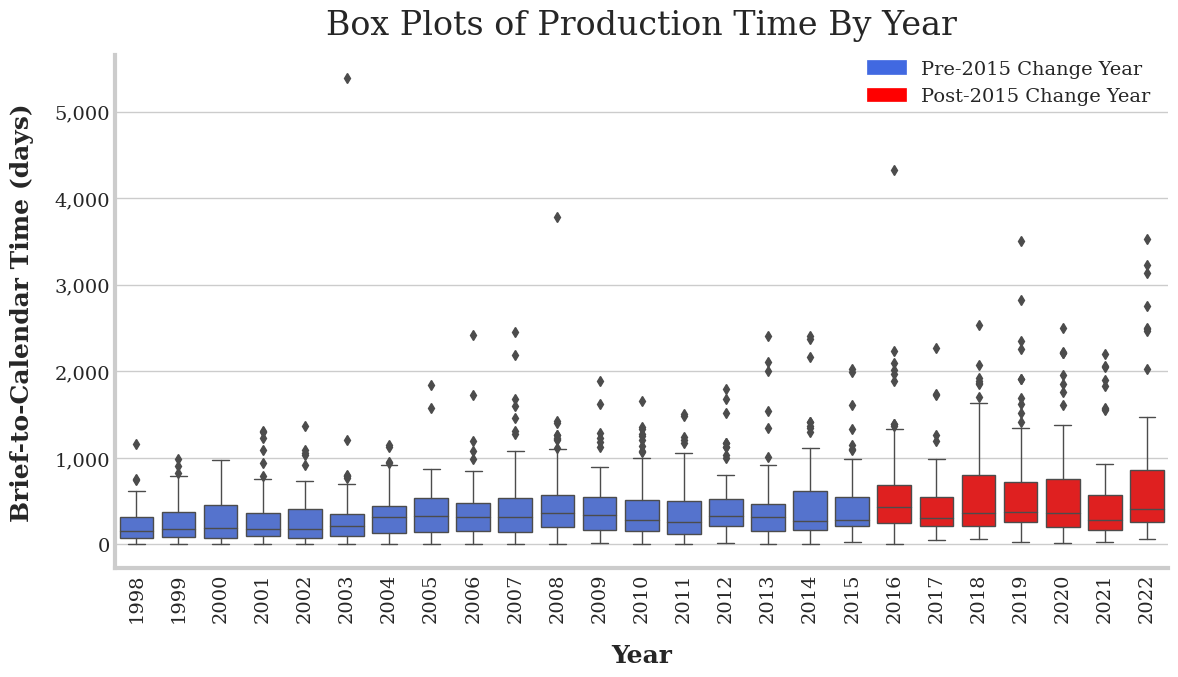
The box plot shows that the variance in each year’s range is greater after 2015, even excluding outliers. The minimum time is greater after 2015, and the highest maximum values are after 2015. We already know from Figure 2 that the medians (the box midlines here) increase over time. And the increasing box size over time, and markedly larger boxes after 2015, show how the dispersion compares: the box lengths (the interquartile range) are more spread out after 2015. From this we conclude that after the policy change there is a much greater possible range of time to resolve a given case, and the minimum and maximum likely times are greater.
The upshot is that the high end of the value’s range is getting higher over time, or the outliers are moving farther out and becoming more frequent. In the past, the court more consistently decided more of its cases in a narrower range of possible durations, and more recently enough cases are taking much longer that they are both increasing the average and less reasonably excludable as outliers.
Counterpoint: the court is resolving more cases
The new grant-and-hold procedure arguably results in the court deciding more cases than it did before. It’s certainly true that the court is now granting more petitions: the 2022 year-in-review showed that the total number of petitions granted (as a raw number or as a percentage) is trending up significantly. Consequently, one view is that the court is “resolving” more cases: the Court of Appeal now receives clear guidance on dispositions for all the extra granted-and-held cases following the lead opinion. That guidance suggests that the 2015 policy change resulted in a major shift of case determinations from the Court of Appeal to the California Supreme Court.
Thus, whether our state high court is doing more or less work is somewhat perspective-dependent. One view is that even with static resources the court has with a simple policy change greatly expanded the direct impact of its opinions by giving the Court of Appeal clearer directions to resolve held cases according to the lead opinion. On this view, with a single opinion the court can resolve potentially hundreds of cases, in a major win for efficiency. For example, People v. Harris was held for People v. Strong. After Strong was decided, the court issued an order dismissing and remanding Harris:
Dismissed and remanded to CA 2/7. Review in the above-captioned matter, which was granted and held for People v. Strong (2022) 13 Cal.5th 698, 296 Cal.Rptr.3d 686, 514 P.3d 265 and People v. Lewis (2021) 11 Cal.5th 952, 281 Cal.Rptr.3d 521, 491 P.3d 309 is hereby dismissed. (Cal. Rules of Court, rule 8.528(b)(1).) As specified by rule 8.1115(e)(2) of the California Rules of Court, pursuant to this order, the Court of Appeal’s opinion, filed February 16, 2021, which appears at 60 Cal.App.5th 939, 275 Cal.Rptr.3d 206, is noncitable and nonprecedential “to the extent it is inconsistent with” our decision in Lewis.
517 P.3d 4, 299 Cal.Rptr.3d 5 (Mem) PEOPLE v. HARRIS S267802 September 28, 2022 Second Appellate District, Div. 7, B300410
The center’s active docket currently shows 262 held cases — all likely will receive similar memorandum dispositions.
The other view that our data support is that the court is spending far more time to decide far fewer cases than ever before. Even if held cases are eventually resolved by the lead case, all those cases wait on a lead case that is taking much longer to resolve. Parties in the lead case probably care little about the held cases and prefer their opinion to arrive sooner. Parties in the held cases might get faster results from the Court of Appeal under the old policy. And the held cases arguably contribute less to the law — only the lead opinion becomes California Supreme Court precedent.[8] Although the immediate effect of its decisions on held cases may be broader, with fewer and slower merits opinions each year the court is arguably having less effect on the law going forward. Fifty years from now there will be far more opinions in the books to be cited from the Chief Justice George era than from the current court.
Finally, fairness may also benefit. Our observations above about parties wanting faster results might be true for civil cases, but they likely are untrue for criminal defendants and their appellate cases. If the court did not grant and hold all related criminal appeals, the Court of Appeal decision would become final and those defendants would lack any further appellate remedy, even if the lead case were ultimately resolved in their favor. Under the old policy those defendants could only resort to a habeas petition to gain any relief provided by the lead opinion — without the benefit of having counsel. That fairness concern could have animated the court’s 2015 policy change.
Conclusion
Our empirical studies do not address two key questions: why this is happening and what it means. Data alone can show only so much, and there are some pivotal questions that we cannot reach. For example, what is causing the increasing inconsistency in the court’s opinion production time? How is the unanimity rate staying so high, and is it causally related to the other trends? Just as with our previous data studies, the answer to such questions can come only from within. Similarly, studies like this are the wrong vehicle for addressing “is this good-or-bad” debates about the proper role of a state high court. Our empirical research on the court’s performance metrics can be ammunition for dueling arguments on such questions.
Finally, it’s interesting that several procedural changes occurred during the court’s last decade. In 2015 David Ettinger noticed that “Justice Liu revived a long-dormant practice of issuing separate statements when the court denies review, and he and other justices have done so on numerous occasions since then.”[9] The Daily Journal identified “the two new justices” (Kruger and Cuéllar) as responsible for the 2015 policy change to grant-and-hold many formerly dismissed petitions.[10] And about a year later in 2016–17 the court started issuing warning letters in all cases.
Those events roughly correspond with the inflection point revealed in our three studies of annual opinions, unanimity rate, and opinion production time: all three metrics change significantly after 2016. In all the commentary (some written here) speculating about substantive changes on the state’s high court stemming from the appointments by governors Brown and Newsom, the effects of these procedural changes have been underexamined. By contributing to either many more or far fewer California Supreme Court decisions (depending on one’s perspective), procedure may be as significant as substance.
—o0o—
Research fellow Grayson Peters merits sole credit for building the dataset here. Senior research fellows Professor Quinn Keefer and Kira Klatchko (who acted solely in her academic capacity) and chief senior research fellow Stephen M. Duvernay contributed to this article. Active Digital validated our analysis and produced several of the data visuals.
-
The last brief filed to ordered on calendar time value we focus on starts from the last party’s merits reply brief. We excluded all amicus curiae briefing and any supplemental briefing that the court requests. Ignoring amicus briefing is consistent with the conventional wisdom that it rarely matters. And ordering supplemental briefing can fairly be considered part of the court’s drafting process, broadly stated. ↑
-
Roemer, New justices seen in court’s subtle changes, Los Angeles Daily Journal (Jul. 10, 2015). ↑
-
There are exceptions to this general procedure. For example, the court may elect not to grant and hold a case (even if its petition for review raises an issue pending in a granted lead case) because its resolution of the lead case would not affect the outcome, as when there is an alternative ground to affirm the Court of Appeal’s disposition. ↑
-
Cal. Const. art. VI, § 19 (“A judge of a court of record may not receive the salary for the judicial office held by the judge while any cause before the judge remains pending and undetermined for 90 days after it has been submitted for decision.”); Gov. Code, § 68210 (“No judge of a court of record shall receive his salary unless he shall make and subscribe before an officer entitled to administer oaths, an affidavit stating that no cause before him remains pending and undetermined for 90 days after it has been submitted for decision.”). ↑
-
A statistical correction known as Bessel’s correction was applied to the standard deviation, which is recommended for data where an unknown mean and standard deviation are being estimated. ↑
-
A T-test is a way to statistically test for a difference in means before and after the change in the population. It is a simple and common method that is often reported when comparing the averages between two groups. The p-value addresses what the probability is that the difference in means would be greater than 218.2 or less than -218.2 in a new sample from the population. If the p-value is small this is evidence against the null hypothesis being correct; here there is little difference before and after the change. ↑
-
The top whisker line marks the maximum value in the data. The length of the top whisker represents how far the highest value is from the median of the dataset. Anything beyond that is excluded as an outlier. The top edge of the box marks the third quartile of the data. The bottom edge of the box marks the first quartile of the data. The line in the box’s middle is the second quartile (the median data value). The length of the bottom whisker represents how far the lowest value is from the median of the dataset. The bottom whisker line marks the minimum value in the data. ↑
-
After a grant and hold remand the Court of Appeal may further develop the law, as by re-deciding the matter in a published opinion, thereby establishing new precedent. Our point here concerns how many net California Supreme Court opinions result. ↑
-
See At the Lectern, The case for publishing Justice Liu’s dissent, November 2, 2015 (Justice Liu’s dissenting statement “wasn’t the first one ever in California Supreme Court history . . . [b]ut, as far as we can tell, it’s the first one in over 50 years.”), and Two separate statements accompany denial of review of domestic violence victim’s murder conviction, April 13, 2023. ↑
-
Roemer, New justices seen in court’s subtle changes, Los Angeles Daily Journal (Jul. 10, 2015). ↑