SCOCA Year in Review 2017: (Almost the) Brown Court


SCOCA Year in Review 2017: (Almost the) Brown Court
With Justice Werdegar’s retirement (her last day was August 31), Governor Brown has a rare opportunity to appoint a fourth justice to the California Supreme Court. That will create a Brown-appointee majority on the seven-member court. To provide some perspective on what that could mean, in this article we analyze the court’s recent performance. Of course, no one but Governor Brown knows when a new justice will be appointed, and no one knows for sure what effect that person will have on the court. Rather than speculate about those unknowns, this article reviews objective data taken from the Court Statistics Reports published annually by the California Judicial Council from 1989 to the present. Focusing on the court’s performance since 2011 (the year Governor Brown’s first appointee Justice Liu joined the court) and three particular metrics (petitions granted, written opinions, and concurrence), we make some educated guesses about the potential impact of the new appointee.
Intake
The court’s grant rate remains consistently low. In any given year during the 27-year period we reviewed, the court granted review in a similarly small number of cases. The average grant rate since 1989 is 4.49%. Since 2011, the grant rate has been even lower—with a 3.73% average grant rate. This recent trend is stable: viewed either by number of petitions granted or percent of petitions granted, the recent trend line is flat.
Figure 1
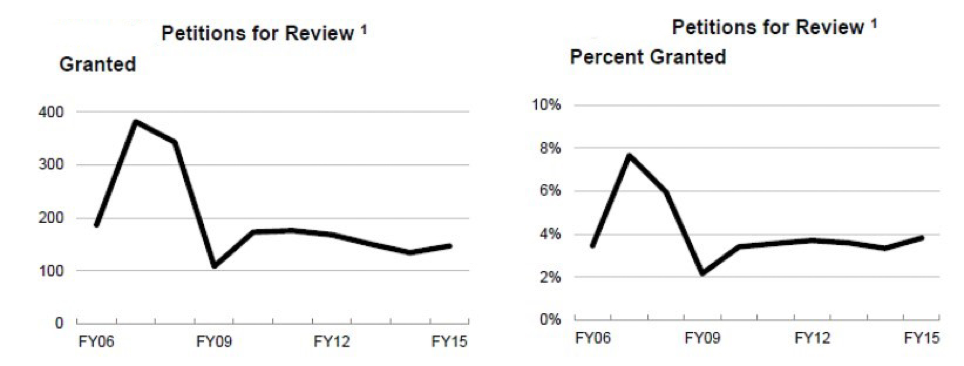
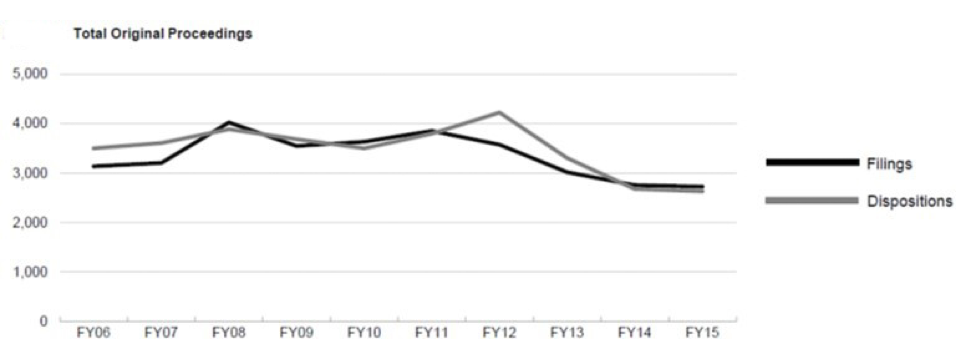
Figure 1 shows that the total number of grants has been relatively consistent since 2011, after hitting a low in 2009.[1] The number of grants each year since 2011, however, is far lower than the peaks reached during the late 2000s. Despite this, the two figures look similar. This could indicate that the number of petitions granted fluctuates with the number of petitions filed. Figure 2 below supports this view, showing the annual totals of petitions filed and opinions issued have both decreased since the late 2000s at roughly the same rate.
As we noted above the grant rate since 2011 has been less than one percentage point lower than the average grant rate since 1989 (4.49% since 1989; 3.73% since 2011). This shows the average grant rate has stayed relatively stable notwithstanding the drop in the number of filings, and the similarity in the total and percent graphs in Figure 1 seems to support that view. Accordingly, one might assume the number of grants will increase if the number of filings increase. The fact that the court published more opinions in past years when more petitions were filed supports this theory. In the future it will be interesting to see if the annual number of petitions filed increases, if the number of grants also rises. A more stable set of justices could contribute to this; we note that the period when the court published the most opinions annually (2000 to 2009) coincides with a period (1996 to 2011) when the court lost only one member.
Figure 2
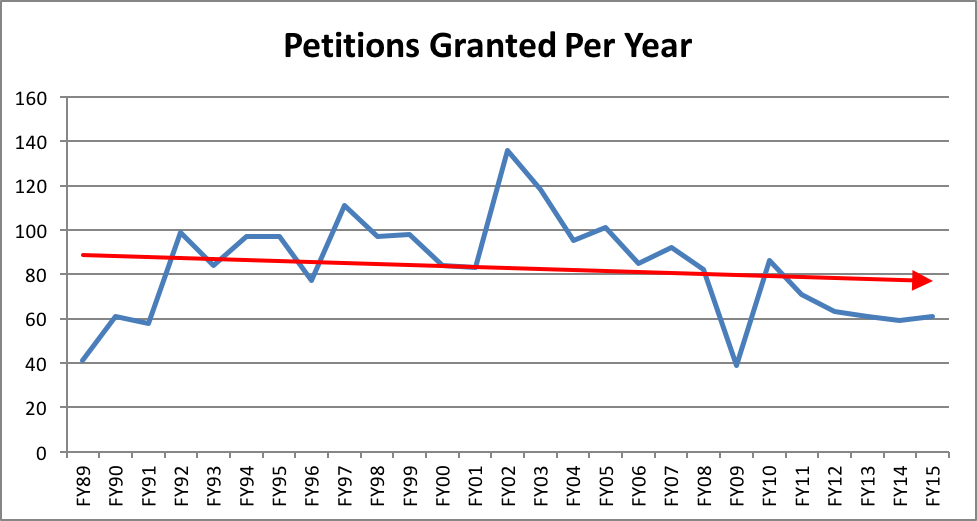
But the similarity in the short-term trends in Figure 1 is hardly conclusive. While a 0.76% percent difference seems negligible, the consequences may be significant, whether viewed proportionally or comparatively. That 0.76% difference represents a 17% drop in the grant rate. And the number of yearly grants in each of the previous five years is below the 27-year average. Finally, as shown in Figure 3 below, the 27-year trend shows decreasing numbers of petitions being granted each year. The most we can conclude from the similar downward trends in petitions filed and petitions granted is that they correlate over this period, but we cannot be confident that they are causally related.
Figure 3
Output
From fiscal year (FY) 1989 to 2015, the court issued an average of just below 100 opinions per year. But the court’s output over the past 27 years has not been constant. In particular, its output rate has decreased since FY 2011, especially when compared to the court’s output during much of the 2000s.
Figure 4 below shows the number of California Supreme Court opinions per year. The red line shows the decrease in average yearly opinion output for the whole period.
Figure 4

The table below shows yearly opinion output by the California Supreme Court per fiscal year from 1988 to 2015 (the most recent year with official figures). Over this 27-year period the average opinion output is 99.75. The annual average since 2011 is 88.
| Fiscal year | Written opinions | Petitions for review | |||||
| Grants | Grant and hold | Grant and transfer | Total grants | Denied | Percentage
Granted |
||
| FY15 | 76 | 61 | 48 | 38 | 147 | 3711 | 3.96 |
| FY14 | 85 | 59 | 47 | 28 | 134 | 3896 | 3.43 |
| FY13 | 94 | 61 | 46 | 43 | 150 | 4,032 | 3.72 |
| FY12 | 87 | 63 | 71 | 34 | 168 | 4,378 | 3.83 |
| FY11 | 98 | 71 | 69 | 36 | 176 | 4,769 | 3.69 |
| FY10 | 96 | 86 | 44 | 43 | 173 | 4,911 | 3.52 |
| FY09 | 116 | 39 | 33 | 36 | 108 | 4,896 | 2.21 |
| FY08 | 116 | 82 | 210 | 51 | 343 | 5,406 | 6.34 |
| FY07 | 113 | 92 | 252 | 38 | 382 | 4,609 | 8.29 |
| FY06 | 125 | 85 | 60 | 42 | 187 | 5,226 | 3.58 |
| FY05 | 125 | 101 | 133 | 33 | 267 | 4,847 | 5.50 |
| FY04 | 108 | 95 | 48 | 23 | 166 | 4,750 | 3.49 |
| FY03 | 123 | 118 | 66 | 35 | 219 | 4,878 | 4.49 |
| FY02 | 101 | 136 | 74 | 24 | 234 | 5,064 | 4.62 |
| FY01 | 103 | 83 | 63 | 38 | 184 | 5,257 | 3.50 |
| FY00 | 124 | 84 | 92 | 32 | 208 | 5,248 | 3.96 |
| FY99 | 88 | 98 | 98 | 25 | 221 | 5,197 | 4.25 |
| FY98 | 97 | 97 | 89 | 25 | 211 | 5,444 | 3.88 |
| FY97 | 82 | 111 | 76 | 35 | 222 | 4,854 | 4.57 |
| FY96 | 102 | 77 | 94 | 42 | 213 | 4,318 | 4.93 |
| FY95 | 97 | 97 | 51 | 31 | 179 | 4,014 | 4.46 |
| FY94 | 99 | 97 | 109 | 25 | 231 | 4,401 | 5.25 |
| FY93 | 102 | 84 | 80 | 52 | 216 | 3,814 | 5.66 |
| FY92 | 89 | 99 | 56 | 24 | 179 | 3,467 | 5.16 |
| FY91 | 127 | 58 | 65 | 70 | 193 | 3,314 | 5.82 |
| FY90 | 100 | 61 | 44 | 45 | 150 | 3,252 | 4.61 |
| FY89 | 120 | 41 | 38 | 61 | 140 | 3,052 | 4.59 |
| AVERAGE | 99.75 | 82.81 | 79.85 | 37.37 | 200.04 | 4,481 | 4.49 |
The recent negative trend in the number of opinions per year begins in FY 2006, with the most significant drop (16%) in output occurring from FY 2009 (116) to FY 2010 (98).[2] Note that in FY 2015 the court was short two members after Justices Kennard and Baxter retired; we suspect this is why FY 2015 was the court’s least productive opinion year since the 1980s. Indeed, some of the decreased output since FY 2011 may be attributed to the court’s loss of four members during that five-year period: Chief Justice George and Justice Moreno (2011), Justice Kennard (2014), and Justice Baxter (2015). Thus, the retirement of Justice Werdegar in 2017 may result in lower output by the court in FY 2018. Because of the large number of changes in the court’s composition since FY 2011, we can draw no conclusions from these numbers about the court’s relative efficiency over the past five years.
Moreover, a variety of factors can affect the court’s output. For example, one factor with an uncertain effect on the court’s production capacity limit is its number of members and the size of their staffs. The court has been fixed at seven seats since 1879, and each justice has had five staff attorneys for over two decades. We are unaware of any movement to increase the number of justices or their staff, absent which the theoretical per-justice output limit is unlikely to change.[3] And until Justice Werdegar is replaced, the court must employ pro tem justices from the Court of Appeal, so there is little reason to believe that the opinion number will increase in the near future. Historically, the loss of a justice has decreased the court’s output of published opinions notwithstanding the use of pro tems (this is because pro tems typically do not author majority opinions). But there is some conflicting evidence. For example, Justice Brown left in 2005, and during the four years after her departure, the court published over 100 opinions each year, while Justice Moreno and Chief Justice George left in 2011, and during the four years after their departures the court has issued fewer than 100 opinions each year. Of course, the large number of changes to the court’s composition since Justice Moreno and Chief Justice George left in 2011 may account for this discrepancy.
Ultimately, more data is needed before we can draw any reasonable conclusions about the current court’s output.
Agreement rate
The agreement rate among the justices remains high (> 90%). Figure 5 below shows today’s values for the cumulative concurrence rates among the justices since FY 2015. For comparison, Figure 6 shows the same current snapshot of the SCOTUS justices.
Figure 5: California Supreme Court justices voting relationships
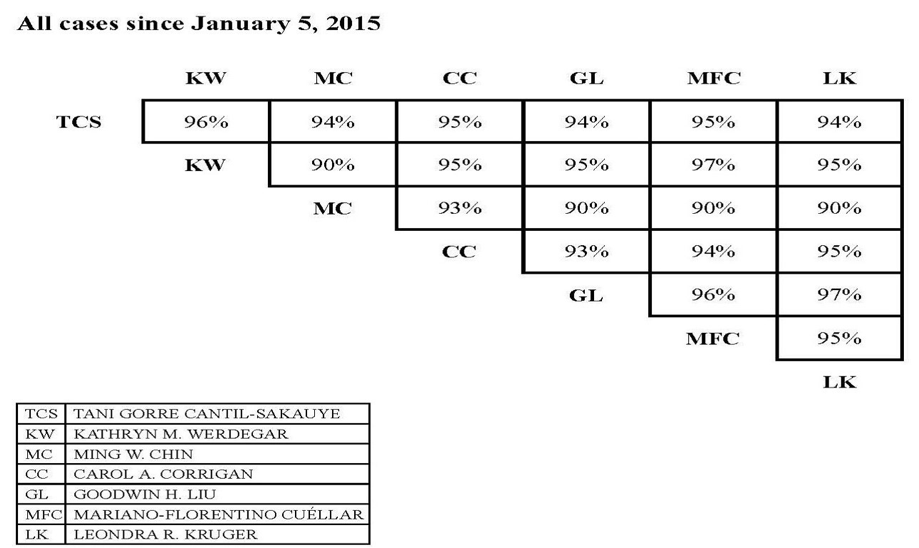
Figure 6: U.S. Supreme Court justices voting relationships (Source: SCOTUSblog)
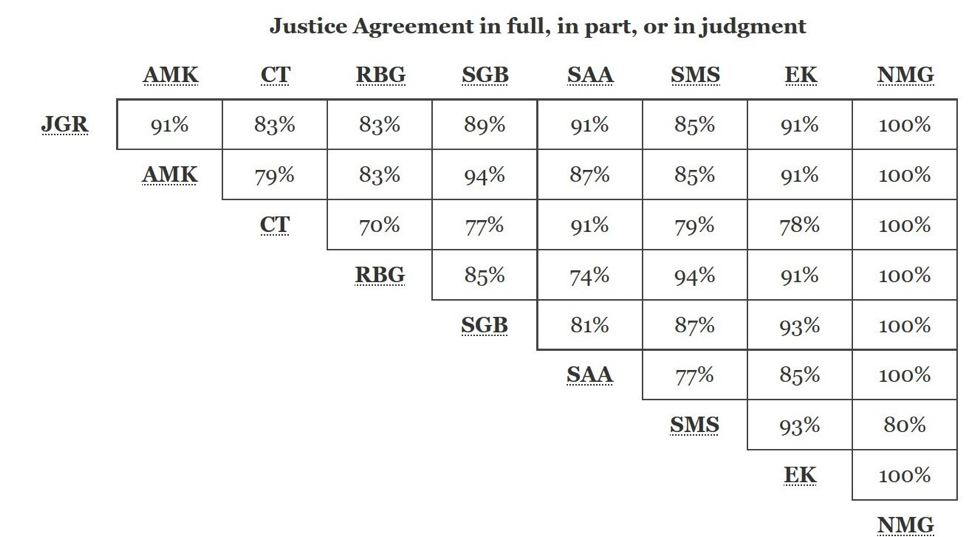
The SCOCA justices show a very high agreement rate in published decisions since 2015, both in isolation and in comparison to SCOTUS. This may be due, in part, to the 90-day rule—which requires the court to issue its opinions within 90 days after the oral argument. As a result, the court generally will not schedule argument unless four justices have largely agreed on the outcome and reasoning and the court has a draft majority opinion written. This process encourages agreement ahead of the argument and discourages dissents because the dissenting justice generally has only 90 days to draft a dissenting opinion.
Conclusion
A substantive discussion about the current court’s direction and its jurisprudence must wait until Governor Brown appoints a new justice, and until the new court has sat together for a number of years. All we can say at this point is that the court’s objective performance metrics for the past five years are consistent: the court will likely continue to grant approximately 3.5% to 4% of the petitions filed and issue approximately 80 to 90 published opinions each fiscal year, at least in the near term. Nonetheless, the pending appointment of a fourth Brown justice could have a dramatic impact on the court. And a fifth appointment is theoretically possible, if Justice Chin (currently the longest-serving justice) retires in the next few years; he has been on the court for 20 years, twice as long as the next-most-senior justice (Corrigan, 10 years). We find a “past as prelude” prediction particularly inapt here, given that this governor’s recent and 1980s appointments have performed so differently. As a result, California will just have to wait and see.
Senior Research Fellow Danny Y. Chou contributed to this article. The views expressed here are solely his own, and here he writes only in his academic capacity.
[1] Figures 1–4 are drawn from the Court Statistics Reports (https://www.courts.ca.gov/13421.htm).
[2] We see no obvious explanation for this. No justices left in those years: Brown left in 2005, then the next departures are George and Moreno in 2011. And in the 10 years before this drop the court published over 100 opinions every year.
[3] The yearly maximum number of working days for the justices is 210. Roy A. Gustafson, Some Observations about California Courts of Appeal, 19 UCLA L. Rev. 167, 177 (1971). Thus, publishing around 100 written opinions per year (approximately the 27-year average) requires the justices to issue an opinion every other day on average. Publishing more opinions obviously requires either more capacity or faster production.