Why we’re not worried about SCOCA productivity


Overview
In this conclusion to our series on the California Supreme Court’s recent performance we argue that the valid concerns some have raised about the court’s opinion output do not constitute a crisis. Annual decision tallies are just one performance metric that decreases in significance when considered with other factors. Comparing the decades 2000–10 with 2010–21, in the later period there were fewer petitions for review, more vacancies, more new justices without prior judicial service, a new grant-and-hold policy, and changes in individual justice performance. Considered together those distinctions can explain both the higher annual figures in the past and the lower figures today. And to the extent productivity stands alone, it may soon be moot: a new chief justice is beginning to reshape the court, and the court’s recent year-in-review report shows opinions trending up.
Analysis
Comparative analysis is unhelpful
Considered alone, whether California’s high court decides five, or 50, or 5,000 cases a year tells us little about the court’s efficiency and effectiveness. The annual opinions number is arguably only significant in context: how does it compare to the federal high court, or other state high courts, or to our court’s own past performance? For example, California’s 54 high court opinions in 2021 from its seven justices compares favorably with the nine-justice U.S. Supreme Court, which according to SCOTUSblog decided 66 cases in its 2021 term. But if California were included in the National Center for State Courts data table for cases decided on the merits that year by state high courts of last resort, it would rank near the bottom of states reporting this figure:
State | 2021 |
West Virginia | 849 |
Nevada | 592 |
Montana | 565 |
New Hampshire | 343 |
Alabama | 338 |
Kentucky | 302 |
Georgia | 297 |
Mississippi | 297 |
Delaware | 290 |
Louisiana | 266 |
North Dakota | 250 |
Rhode Island | 241 |
Vermont | 211 |
Oregon | 167 |
South Dakota | 160 |
Alaska | 150 |
North Carolina | 149 |
Wyoming | 141 |
New Mexico | 128 |
Texas | 117 |
New Jersey | 116 |
Minnesota | 113 |
Idaho | 112 |
Iowa | 112 |
Arkansas | 107 |
Hawai’i | 90 |
New York | 80 |
Michigan | 78 |
Washington | 72 |
Missouri | 67 |
California | 54 |
Indiana | 48 |
Tennessee | 35 |
Maryland | 24 |
Yet such comparisons can be quite misleading because states vary widely in population size and because they structure their appellate courts differently. For example, Texas has two high courts, and in 2021 its Court of Criminal Appeals decided a whopping 1,874 cases. Other state high courts resemble California’s, sitting above an intermediate appellate court and exercising discretionary review. But many state high courts — like West Virginia’s — serve as the state’s only forum for appellate relief, which partly explains why the opinion outputs in West Virginia, Nevada, Montana, and New Hampshire are so high. And of course New Hampshire’s population of 1.4 million is no comparison to California’s 39 million. Those population and structural differences make state high court opinion outputs a poor direct comparison nationwide. And as we often note the federal high court has more differences than similarities to the California Supreme Court, making it an equally inexact reference.
The better reference is our court’s own past performance, so our yearly reviews track its year-to-year trends. But even that analysis arguably is only useful for the recent past. Comparing the present and historical California high courts is difficult because they differed in their operations, composition, and characteristics.
The court’s internal operations changed substantially over time. A century ago the seven regular justices rarely sat together and instead used a divide-and-conquer strategy to produce hundreds of opinions with departments, commissioners, and heavy use of pro tem justices and per curiam opinions. This was necessary because the 1879 constitution required the court to decide all appeals, and possible because it also divided the court into two departments of three associate justices each (with the chief justice presiding), with the option for en banc review.[1] And in 1885 the legislature directed the court to appoint commissioners to help with its workload.[2]
None of that is true today. The Court of Appeal was established in 1904 and gradually expanded to its present size and case-processing volume.[3] The commissioner system ended on paper in 1904 when the first three Court of Appeal districts were created, and soon after both the department and commissioner systems were abandoned. Today’s California Supreme Court decides every case en banc.
And those long-past justices varied widely in their experience, with a 26-year-old chief justice, a chief justice who only served eight weeks, and many members who lacked prior judicial service or even law degrees. By contrast, modern justices all have law degrees, many served on lower benches, and they generally serve for longer terms. That long-term variation in justice characteristics makes it difficult to compare a current justice with one who sat 100 years ago. It also makes the stark contrast between the George court’s members (stable, all prior Court of Appeal justices) and the Cantil-Sakauye court (variable, some with no judicial experience) much more useful here than a sweep-of-history comparison. Accordingly, below we compare two recent decades: George’s tenure 2000 to 2010 and Cantil-Sakauye from 2010 to 2021.
The effect of docket changes
The Judicial Council’s annual figures show that the George decade saw a higher volume of incoming cases. This resulted in comparatively fewer cases entering the high court’s pipeline after George retired and a smaller pool of petitions for review during Cantil-Sakauye’s time. Figure 1 compares the decade-to-decade petitions and shows a significant disparity in the raw number of petitions filed (black lines are filings, gray lines are dispositions):
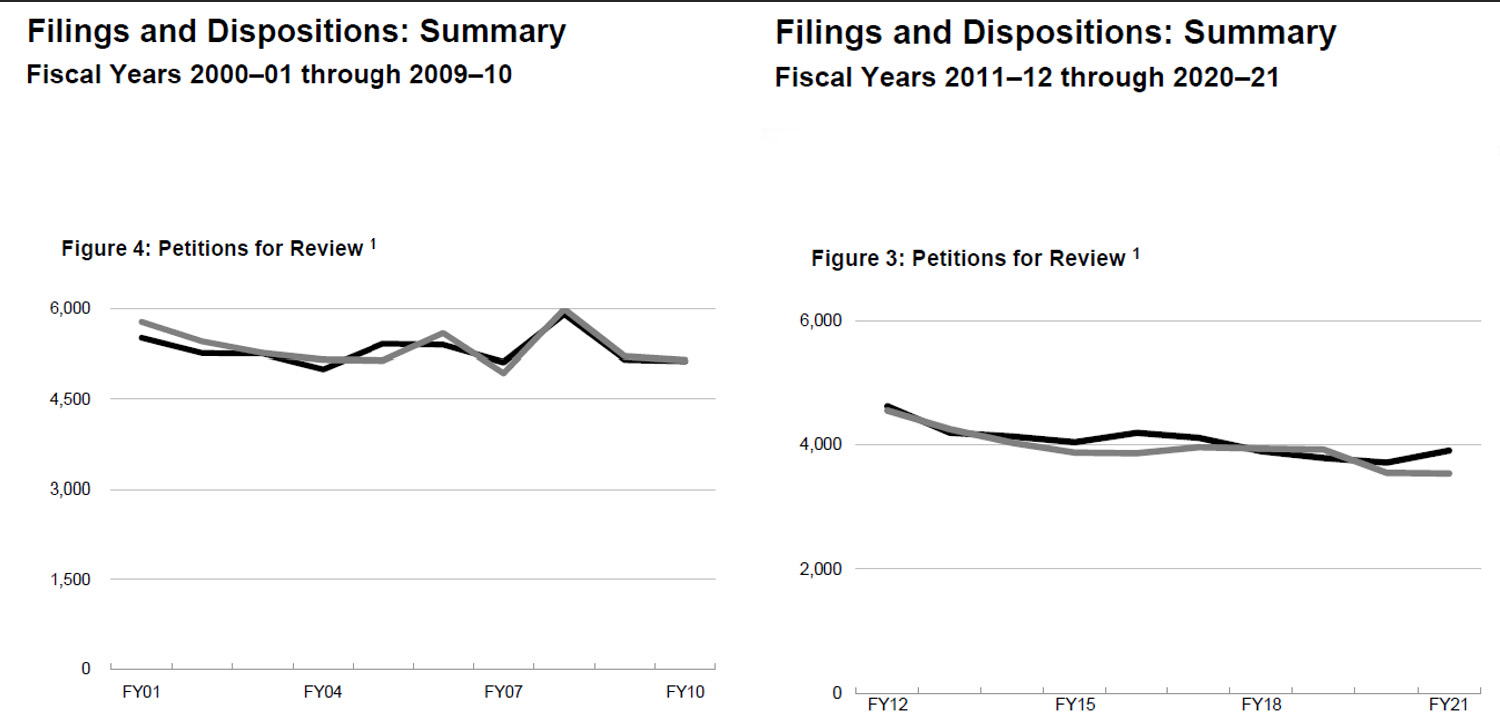
Figure 1
And Figure 2 is our whole-period trendline, compiled from the same historical Judicial Council reports, similarly showing that filed petitions decline in the most recent decade:
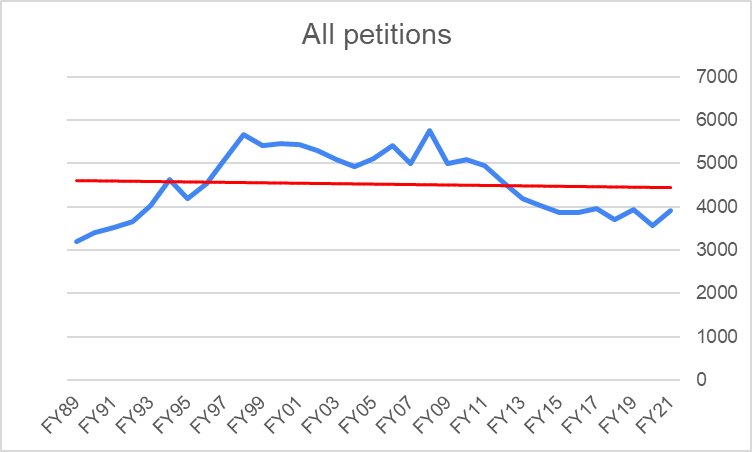
Figure 2
In George’s decade petitions for review sit in a stable range between 5,000 and 6,000 — but during Cantil-Sakauye’s decade petitions average around 4,000 and trend downward. This is consistent with a nationwide trend of declining annual state court appeals. As of 2021, the Court Statistics Project’s five-year trend for all appeals (criminal, civil, and administrative) in the reporting states shows a substantial drop in total new appeals, as shown in Figure 3:
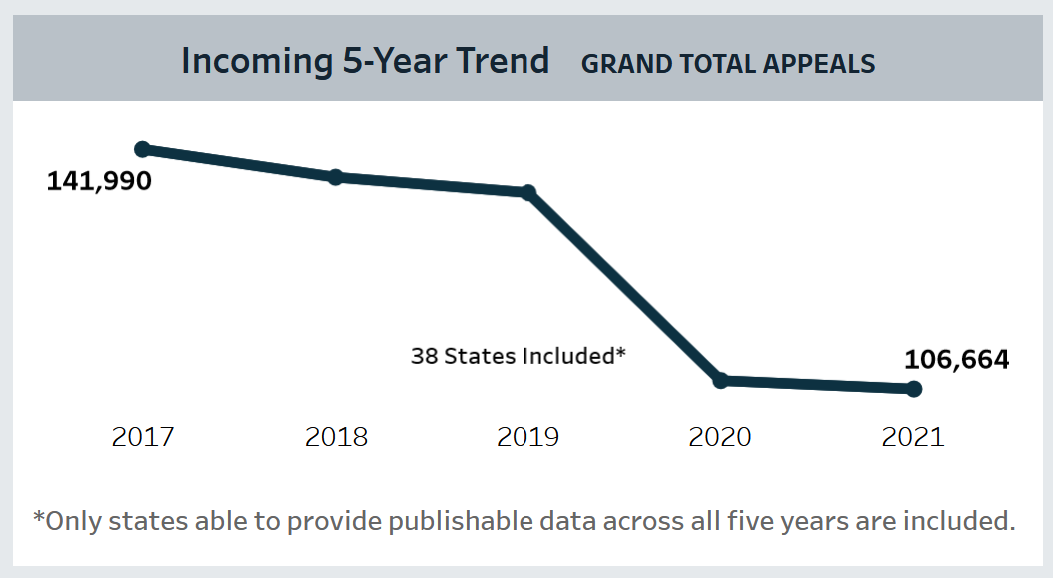
Figure 3
The Project’s figures for California’s past five years also show falling numbers for all appeals, not limited to high court petitions. And Figure 4 illustrates that when sorted for court of last resort in California the Project’s figures show declining total annual incoming civil and criminal appeals, particularly for criminal cases:
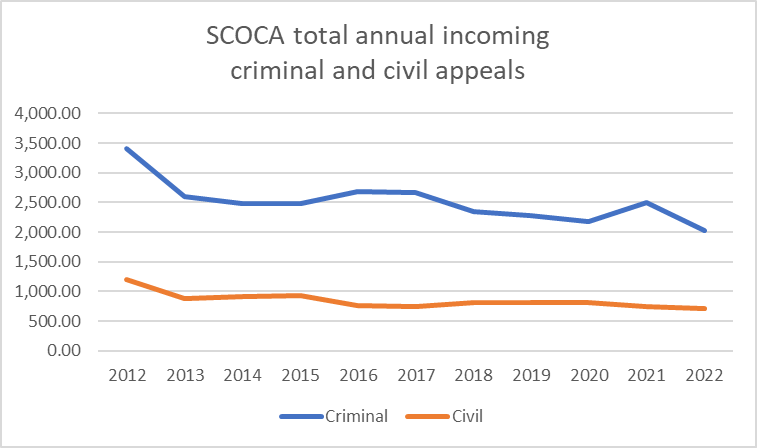
Figure 4
The takeaway here is that comparing the court’s two most recent decades shows that there are fewer incoming cases now. Even so, the court still receives around 4,000 new petitions each year, so why are opinions falling? For a court with a substantially discretionary docket the decline in petitions should not necessarily explain the decline in decisions — the court can always grant as many petitions as it wants. That was the argument in a recent analysis of the Washington Supreme Court’s similarly declining annual opinion output: “Since the Court’s docket is largely discretionary, the Court could simply accept review of a greater number of cases if it wanted to.”[4] Indeed, as we showed in the 2022 annual review grants are increasing over the past decade. This suggests there should be plenty of cases on desks at 350 McAllister Street that need deciding.
But that argument assumes either that the raw number of straight grants is independent of the incoming number, or that the percent granted is variable — in other words, that the court always grants the same number of petitions regardless of how many are filed. That appears to be untrue. Since 1989 the percent of straight grants is rather stable, varying in a range roughly between one and two percent. If the raw number of petitions falls, and the percent granted remains stable, the raw number of grants will fall. Figure 5 illustrates this:
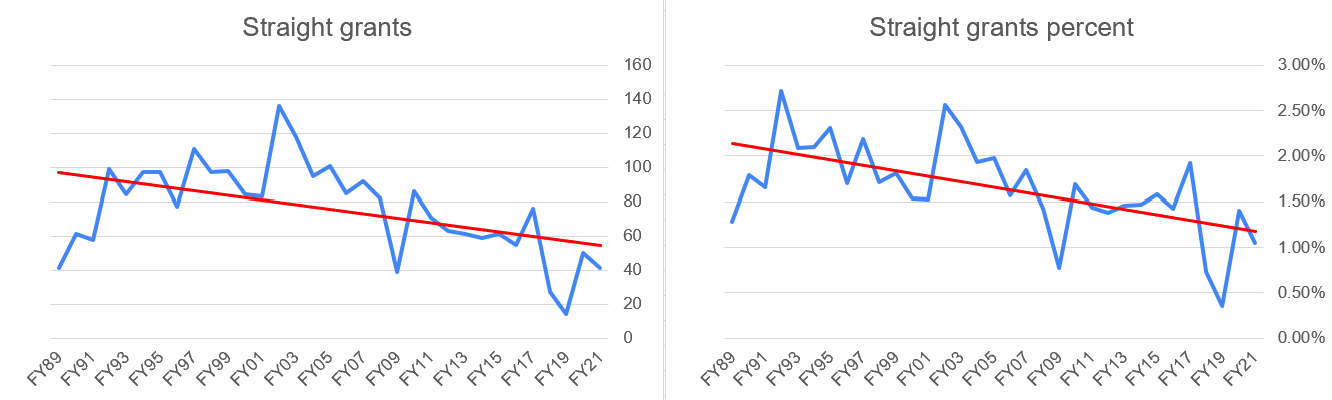
Figure 5
Figure 5 shows that the big decline in raw straight grants started around 2008, coinciding with the drop in petitions filed (see Figure 2) — while the percent of grants remained around 1.5%, consistent with the whole-period average straight grant rate of 1.66%. Because the proportion of cases granted review remained relatively stable, the decreasing filings produced fewer straight grants. This suggests that regardless how many petitions are filed, the fraction of them that merit review remains rather constant. And this partly explains why the court is not simply granting more petitions for review. Another contributing factor is the new grant-and-hold procedure.
The new grant-and-hold policy’s effect
We recently mooted divergent views of the court’s new-from-2015 grant-and-hold procedure. One view holds that because it enables the court to grant more petitions, the court is arguably resolving more cases. The alternate view is that the new grant-and-hold procedure has at most a limited effect because it only applies to criminal cases. Still, if roughly two-thirds of the court’s cases are criminal (automatic appeals and non-capital criminal) as is the common estimate, that’s a substantial portion of the annual opinions. There at least is no question that, as we showed in the 2022 review, grant-and-holds increase significantly starting around 2016. Compare the declining straight grants in Figure 5 with the significant increase in all grants in Figure 6:
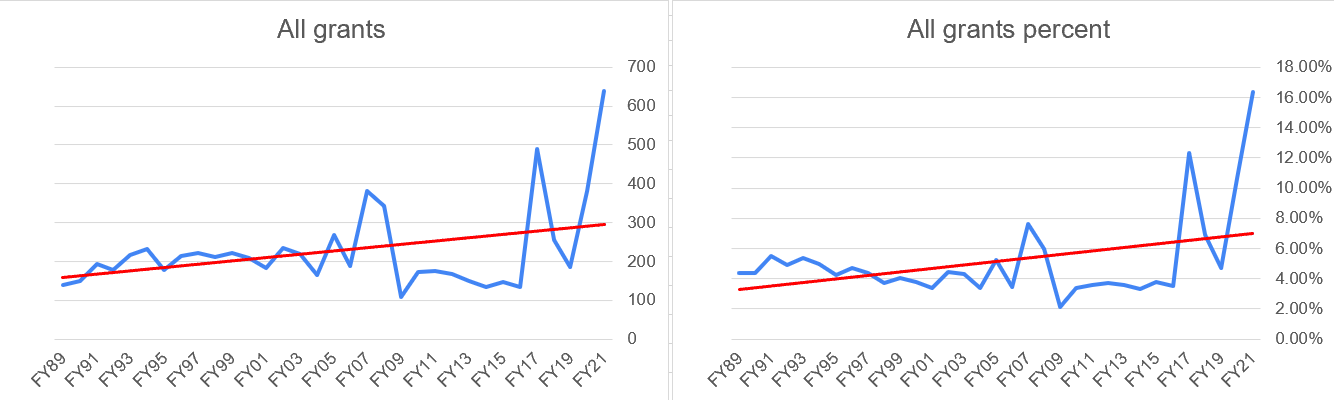
Figure 6
We think the new procedure has two important effects that are both difficult to observe from outside the court. One is that the new procedure magnifies the impact of each lead criminal decision, enabling greater control over the held cases and making the limited number of lead decisions an unreliable indicator for how hard the court is working. The other subtle thing here is that the new procedure requires both the justices and their staff attorneys to spend time reviewing each held case to decide its individual disposition. With potentially hundreds of held cases attached to each lead case, that increases the overall burden on the court’s finite time.
Whether or not one views the new procedure as beneficial, it must be absorbing some time that otherwise could be spent drafting opinions. This means that court is arguably doing more with less: even with fewer incoming cases the court is granting more petitions overall. Those petitions all get resolved, so even if a smaller proportion of them are resolved with opinions, the court is still disposing of more cases even though incoming cases are declining.
But these docket and procedure factors may not fully explain declining opinion output. As discussed below (and as the Washington analysis concluded) other factors are likely also at play.
The effect of vacancies
Four actors can make seat vacancies contribute to workflow slowdowns: the retiring justice, the pro tem, the appointing governor, and the new justice. It’s well-known among court insiders that opinion writing often slows or stops altogether once a justice announces their retirement, leaving the court for months with an effectively empty seat that it cannot fill with pro tems. A governor often needs time to find a replacement, sometimes forcing the court to use pro tem justices — who are not true substitutes due to the burdens of their existing Court of Appeal dockets. And lately it can take a new justice a year or more to start producing opinions at full speed. Combined, these four actions can turn a seat change into a significant drag on the court’s overall productivity.
That drag effect appears in opposing ways when comparing the seat changes in the George and Cantil-Sakauye periods. George served with eight justices: Mosk, Kennard, Baxter, Werdegar, Chin, Brown, Moreno, and Corrigan. There were only two retirements in George’s decade: Mosk and Brown. There was comparatively far greater seat volatility in the next decade, when Cantil-Sakauye served with 12 justices: Kennard, Baxter, Werdegar, Chin, Moreno, Corrigan, Liu, Cuéllar, Kruger, Groban, Jenkins, and Guerrero. There were six retirements in Cantil-Sakauye’s decade: Moreno, Kennard, Baxter, Werdegar, Chin, and Cuéllar. We might also count the seat change from George to Cantil-Sakauye, making it seven.
Thus, Cantil-Sakauye’s decade saw about triple the seat volatility of the George court. And the two longest-ever seat vacancies both occurred in Cantil-Sakauye’s decade: Justice Werdegar’s seat was vacant for 16 months and Justice Kennard’s seat was vacant for nine months. The only two vacancies in George’s decade were shorter: Mosk’s seat was vacant for about four months and Brown’s was open for about six months.
Retirements have a clear effect on productivity. The only year in George’s decade when the court went below 100 opinions was 2001 — when Mosk retired. Similarly, the transition year of 2011 between George and Cantil-Sakauye also saw Moreno retire, and productivity again fell below 100 for the year and declined compared with the previous year. Production fell year-over-year every time a justice retired: in 2005 when Brown retired, in 2014 when Kennard retired, in 2015 when Baxter retired, in 2017 when Werdegar retired, and in 2020 when Chin retired.
The two decades also differed in whether pro tem justices were necessary. During the six months of Moreno’s vacancy, nine months for Kennard, and 16 months for Werdegar those empty seats often were filled by pro tem justices. But the shorter Mosk and Brown vacancies required comparatively fewer pro tem justices. Those differences in how long a seat was open, in how many pending cases a departing justice closed, and in corresponding pro tem use likely caused workflow differences in each period, with the more frequent pro tems in the Cantil-Sakauye decade probably slowing opinion production. That’s not a knock on the Court of Appeal justices: their apparent productivity effect flows from the fact that they are not regular justices and neither produce opinions nor work on any other California Supreme Court matters. That restricted role can reduce the court’s overall productivity when more pro tems are employed.
The takeaway here is that the Cantil-Sakauye court experienced far greater effects from all four actors who can slow production: more justices retired, more pro tems served, the governor waited longer to act, and more new justices needed to be integrated. The fact that several of those justices had no previous judicial experience is also relevant, as explained next.
The effect of no prior judicial service
All of the justices in the George decade had prior judicial service. By contrast, four of the new justices in the Cantil-Sakauye decade lacked any judicial service (Liu, Kruger, Cuéllar, and Groban) and two (Liu and Cuéllar) had primarily academic careers. Any new justice will need time to acclimate to the new position; one expects new justices without prior judicial service might need a bit more time.
Assuming that a justice without prior judicial service needs more time to acclimate to the new role, that will have consequences for how quickly the new justice can start producing opinions and how quickly those opinions get processed. And all the no-prior-service justices in recent memory were seated in Cantil-Sakauye’s tenure, which would contribute to the lower productivity in that period relative to the George court. As we showed in a previous article there is evidence that since 2010 the court is taking longer to decide its cases, which suggests that the court’s internal case-deciding workflow has changed. The upshot is that the arrival of the justices seated since 2010 at least correlates with changes in the court’s performance, and may be a contributing factor.
Only the court can change its metrics going forward
Change, if merited, can only come from within. In a broad study of civil case processing in federal district courts nationwide, researchers found that judicial leadership is essential to making cases move faster.[5] The analysis identified specific initiatives that produced greater case processing speed: internal benchmarks (such as reporting deadlines), public reporting of case management times, and judicial leadership in faster case processing: “the sheer determination of certain judges to bring better management to their dockets is visible in the faster jurisdictions in this study.”[6] The authors concluded that “[w]hatever the initial spark, in most successful courts the driving force was internal, not external. Legislation and rules can only do so much. The commitment of judges (and attorneys and court administrators) to move cases more quickly ultimately creates the conditions of more expedient case processing.”[7]
There is room for movement here, given that California appellate courts have no internal standards for how quickly a justice should process a matter.[8] Yet it’s difficult for a chief justice to force any justice to move faster — these are constitutional officers who largely run their own chambers. The main procedure for moving cases along (used by all chief justices since at least the 1990s) is to spur chambers to finish their preliminary responses by ordering a case on calendar when a draft opinion has four votes. Unfortunately, that has no effect on an authoring justice who is slow to circulate a first-draft opinion.
The takeaways here are that things might move faster if the court willed it so, but absent consensus among the justices that things should move faster it’s unlikely to happen.
Conclusion
We examined this issue after respected appellate experts raised legitimate questions about the court’s productivity.[9] The natural first reaction to falling opinion numbers is that something must be wrong. And our analyses of the court’s performance since 1998 confirmed clear performance trends of greater unanimity, fewer decisions, and slower production — suggesting that something indeed was changing.
But the big picture is more nuanced: output is only one performance metric, other factors must be considered, the court’s activity should be viewed as a whole, and more is not necessarily better. The historical trend is toward fewer annual opinions: from several hundred opinions in the 1900s, to around 200 opinions in 1940–50, to about 100 opinions in the George era. There are several apparent causes: the intermediate appellate court’s expansion, variations in court membership, and declining incoming petitions. Novel modern factors, such as the rise of private judging, may be causing changes. And there are other, hidden considerations: the new grant-and-hold procedure’s obscured effects, and the most recent justices appear to have moved the court toward taking more internal time to produce opinions.
That raises the question of quality versus quantity. Is it preferable to decide many cases quickly, or consider fewer cases more deeply? There is a strong argument that this is a false choice here: Just because the court is spending more time on fewer opinions does not equate to better opinions, nor does it mean that the George court’s many opinions were comparatively worse. We question whether a court that decides more cases necessarily shows superior performance, or whether fewer opinions are surely of higher quality.
A chief justice in particular must also decide between administrative responsibilities and opinion-writing; George and Cantil-Sakauye both generally wrote fewer majority opinions than their colleagues. Yet given their administrative portfolio neither should be faulted for low productivity, with one presiding over trial court unification (which arguably increased the chief justice’s administrative burdens going forward) and the other confronting massive budget cuts (a combined $660 million in 2011 and another $544 million in 2012).[10] Absent misfeasance or neglect, balancing opinion output with other priorities is ultimately a policy decision for each judicial officer and the court as a whole.
We conclude that there is an optimal range for the court’s performance at a given time that accounts for the variables (petitions filed, petitions that meet grant standards, internal conditions) and balances the imperatives (speed, quantity, and quality). To some extent that range is objective: are there unresolved Court of Appeal splits, or is there a long backlog of undecided granted petitions? And there are subjective elements: does a given petition fairly meet the criteria for review, and how much effort should each case receive? Too few opinions leaves confusion in the law, too many opinions could shortchange some cases. Justice delayed denies due process, but overly hasty opinions can be equally unjust. Striking these balances requires both policy judgments and constant adjustment.
Finally, it’s a fair criticism that our take on this issue is overly charitable. There’s a colorable argument that the court is not granting review in cases it should decide, taking too long to draft opinions, and deciding too few cases. And it is clear that the new justices since George left have moved the court’s culture toward increasing the internal process time required to produce and review opinions. Still, we think it best to presume that public servants are acting diligently and with good intentions. Which cases to decide in its discretionary docket, how quickly, and how many are ultimately policy decisions for the court’s justices.
—o0o—
Senior research fellows Stephen M. Duvernay and Brandon V. Stracener contributed to this article.
-
Joseph R. Grodin, Darien Shanske, and Michael B. Salerno, The California State Constitution (Oxford University Press 2016) at 186–87. ↑
-
Dear, California’s First Judicial Staff Attorneys: The Surprising Role That Commissioners Played, 1885–1905, in Creating the Courts of Appeal (2020) 15 Cal. Legal Hist. at 129 (2020). ↑
-
The 1904 amendment that created the Court of Appeal established the First, Second, and Third districts. Later districts were created by statute: the Fourth District from a Second District division in 1929, the Fifth District in 1961 from a Fourth District division, and the Sixth District in 1981from a First District division. ↑
-
Howard Goodfriend, “The Washington Supreme Court’s Shrinking Docket,” King County Bar Bulletin Blog (May 1, 2023). ↑
-
Civil Case Processing In The Federal District Courts, Institute For The Advancement Of The American Legal System, University of Denver (2009) at 83–85. ↑
-
Id. at 78–80. ↑
-
Id. at 82. ↑
-
Debra Cassens Weiss, “Appeals judge accused of excessive delays agrees to retire,” ABA Journal June 6, 2022. ↑
-
David Ettinger, “What’s ailing the California Supreme Court? Its productivity has plummeted,” At the Lectern August 17, 2022, referencing Jon Eisenberg’s Daily Journal article published the same day. ↑
-
Clark Kelso, “The George Court Comes to a Close,” California Bar Journal September 2010; David A. Carrillo, “Chief Justice Cantil-Sakauye’s Mission to Bring Order From Chaos,” California Supreme Court Historical Society Review, Fall/Winter 2022. ↑