SCOCA year in review 2025


Overview
This year it’s apparent that the California Supreme Court has settled into a new normal. As our results show, over the past five years the court’s metrics in general have been rather consistent. Opinion counts remain low, unanimity has fallen to more familiar levels, straight grants are flat, civil cases continue to dominate the docket, and reversals are still the predominant result. This suggests that the court has moved out of the transition phase we posited in last year’s review and that the current trends may be durable. Here we also investigate the possibility we raised last year of an emerging situation-dependent 5–2 or three-way split among the justices. Our analysis shows some support for a contextual three-way split: Liu–Evans, Kruger–Groban–Jenkins, and Guerrero–Corrigan. But the better evidence is for Liu–Evans as a consistent bloc in criminal and capital cases, and the best evidence is for Justice Liu as a one-man separate-opinion machine.
Analysis
Opinion output
This year the court broke its four-year streak of annual decision counts in the 50s when it issued just 48 majority opinions in 2025. That’s the lowest count in recent years. In change-over-time terms, this is a 60.98% decrease from the since-2000 high of 123 decisions in 2004, and represents more than a one-half reduction from the court’s usual over-100 opinions output in the early 2000s. Here we concur and dissent with At the Lectern, which said that (counting cases by term) “the court issued 45 opinions, probably the lowest ever,” and that judging by cases currently scheduled for argument “deciding 36 cases would be an historic low” in 2026. By our annual count this year’s 48 decisions is not the lowest ever: the only other year in the last century when the court published fewer than 50 majority opinions in a calendar year was in 1987 (38 majorities and 24 per curiams). But something like 36 decisions in calendar 2026 would at least be the court’s lowest annual output since 1900 — and likely the lowest ever.
Figure 1 shows the since-2000 annual opinion results. As always, our figures may vary slightly from other sources because we use the calendar year. The Judicial Council’s annual Court Statistics Report follows a fiscal year schedule, and the court issues its own year-in-review report based on a September-to-August year. For example, the court’s most recent report counts 45 opinions from September 2024 to August 2025; the Judicial Council figures for the most recent fiscal year are not available yet.
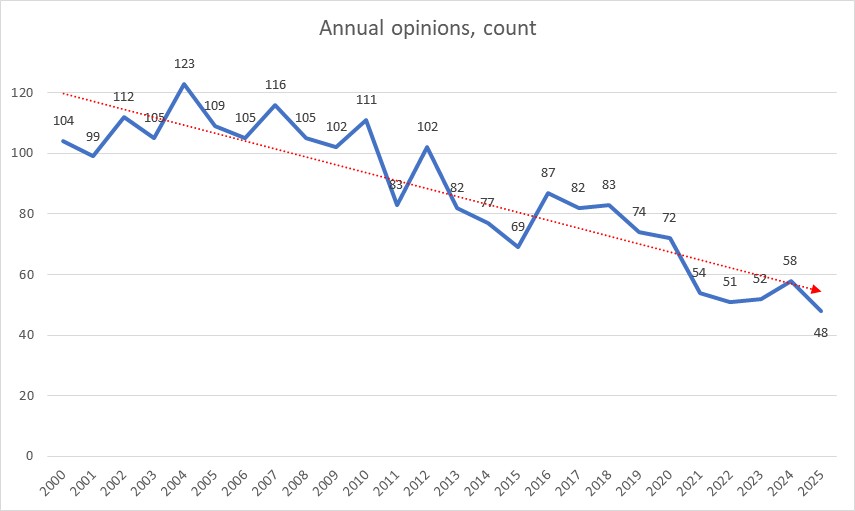
Last year it seemed that opinions could be trending up, with a short-term positive trend suggesting that opinion tallies might increase. That was proven wrong, and there’s little evidence for the idea that anything will reverse or even halt the declining decision pace. This change is the one factor that arguably counters our “new normal” thesis. But we would explain this as “falling annual decision counts are part of the court’s new normal.” One potential change factor here going forward is Justice Jenkins’s recent retirement: the personality of whoever replaces him can have an impact, as can how long his seat remains empty. For example, a long vacancy could further diminish the 2026 opinion count.
In any event, on the output metric we are looking at where this trend bottoms out, and what might be the minimum number of annual decisions for this court. More broadly, one might ask whether the court is deciding enough cases, fast enough, and whether the decisions confront and resolve the core issues. The court’s performance this year could spark reasoned debate on all these points.
Unanimity
Unanimity fell this year to 75%. That’s down almost 20 points from the high of 94% just two years ago in 2023. Figure 2 shows the court’s annual unanimity from 2000 to 2025:

The 25-year trend remains positive, but the court has again moved closer to its 21st century average of 66.04%. As Chief Justice Guerrero predicted in her 2024 State of the Judiciary Address to the legislature (video here, transcript here) the unanimity statistic has indeed changed: it is now much closer to the court’s typical performance. This makes the vote split counts in Figure 3 somewhat misleading: splits appear to be few in recent years, especially when compared with the court’s past figures, but much of that is due to the smaller number of cases in recent years.
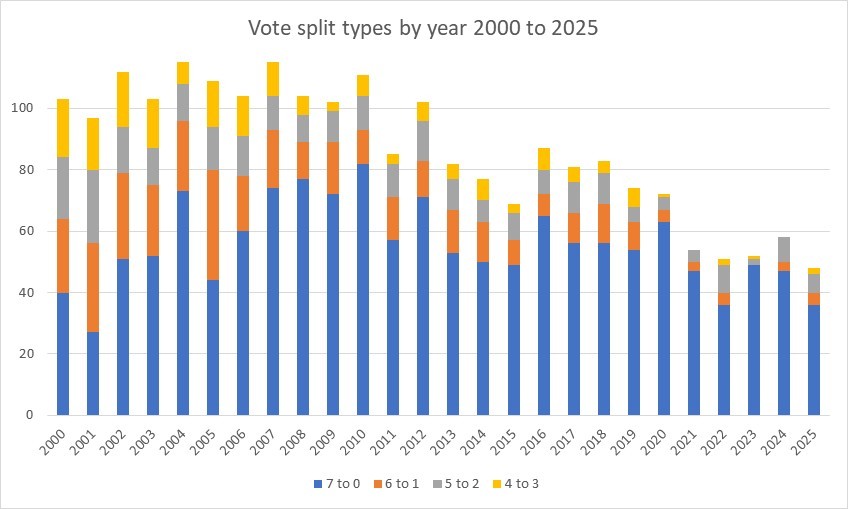
Yet with just one-quarter of the court’s opinions being nonunanimous, this low incidence of vote splits is evidence that this still is not a partisan or polarized court, especially when added to the fact that the appointing governor’s party continues to be of little value in defining justice orientations or predicting the court’s infrequent vote splits. Accusing this court of polarization would be problematic at the outset because Justice Corrigan remains the lone justice appointed by a Republican governor. Instead, with six of the seven justices appointed by Democratic governors one expects greater cohesiveness. As we show in the Liu–Evans section below, a justice’s ideology or philosophy arguably better describes the subject-matter-specific coalitions we can identify in the 25% of nonunanimous decisions.
Case types and results
As Figure 4 shows the court’s case type proportions this year were close to the total proportions since 2000. We counted no habeas cases and just one certified question this year. Civil cases continue to dominate the docket, and capital cases still range from 20% to a quarter of the annual decisions.

Figure 5 shows that this year the court reversed in a clear majority of cases (57%), well above the since-2000 result (42%). The court affirmed in just one-quarter of the cases it decided this year, around half the whole-period result. This could relate to the lower case counts: the court may not be granting review where the Court of Appeal got it right, and instead is focusing on likely-needed reversals. But that does not account for cases resolving a Court of Appeal split — where affirmance or reversal is arbitrary, a function of which case is the vehicle for resolving the split.

One takeaway here for appellate practitioners is that, if our new normal assessment is correct, it’s clear that a case being granted review means a better-than-even chance of reversal. Counting partial results is an even stronger result: a nearly 75% chance of reversal in whole or in part if this year’s proportions carry forward. And that’s true for noncapital cases specifically, given that automatic appeals are generally affirmed.
Petition grants
The grant-and-hold process continues to have a significant effect on one’s view of how many cases the court is reviewing. As Figure 6 shows, overall grants remain elevated.[1]

But the overall volume increase caused by grant-and-holds may be abating. Figure 7 shows that straight grants remain flat, while grant-and-holds appear to be decreasing from their 2022 peak.

Figure 8 shows that in isolation straight grants continue to show a declining trendline, although the decrease in straight grants has somewhat leveled off in the past few years. In general the odds of a given petition for review being granted are still terrible at about one in 73 (or 1.36%).

Without revisiting the debate over how much overall work the court is doing when grant-and-holds are factored in, it’s at least true that a general correlation exists between the decrease in straight grants and annual decisions. For example, the 69.85% decrease in straight grants from the high point in 2002 is close to the 60.98% decrease in decisions from the high point in 2004. Fewer straight grants does not necessarily equate to fewer decisions, but they do seem to track each other.
Word count
As Figure 9 shows majority opinion word count is still trending up, gauged by annual average or by annual median. This year’s annual average is just shy of the peak word count in 2022.

Figure 10 shows that the minimum word count remains high and the maximum word count was above the trendline this year.
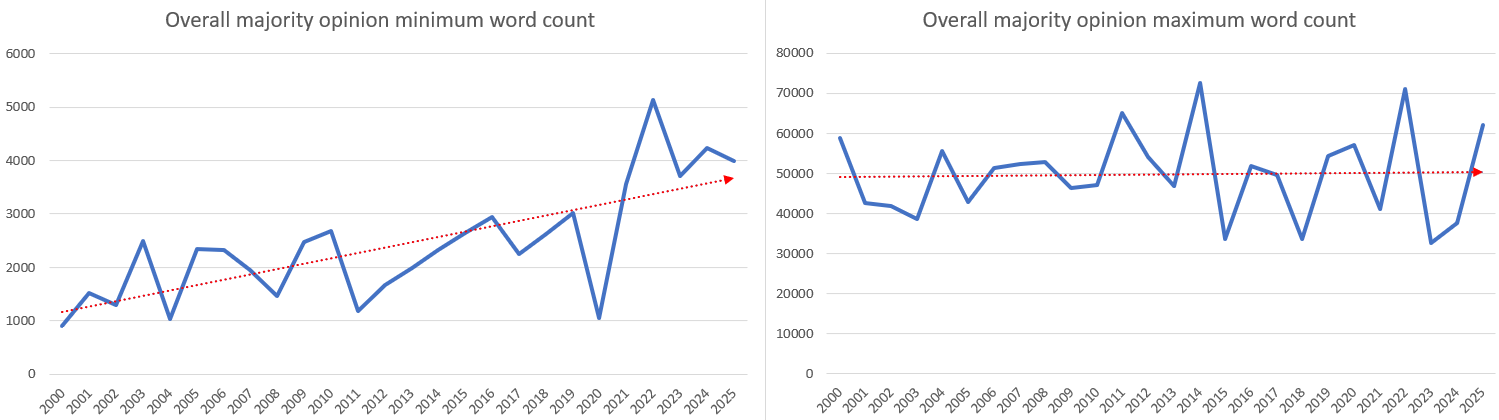
The takeaway from the output and word count metrics, combined with the time to decision metrics in Figure 11 below, is that it’s still true that (as we concluded recently) the court is spending more time writing fewer and longer decisions.
No single factor drives the opinion length or time to decide
We looked for any one factor that might be affecting the court’s overall results, specifically the majority opinion length and drafting time. In our updated time study we found little support for a correlation between those metrics, at least at a high level, and so we could not conclude that longer opinions necessarily took longer to write (or conversely that spending more time drafting meant longer opinions). Still, it remains true that opinion drafting time (measured from the reply brief to argument notice) continues to trend upwards, on average or by medians.

This year’s majority opinions were more evenly distributed
In contrast to the previous two years, in 2025 the justices had a rather even distribution of majority opinions. In 2023 the clear majority opinion leaders were Chief Justice Guerrero and Justice Liu; in 2024 Chief Justice Guerrero and Justice Kruger were the clear leaders. In both those past years the majority opinion leaders were easy to distinguish because they alone produced double-digit tallies.

But in 2025 none of the justices produced ten or more majority opinions. In fact, this is the first year since at least 2000 where that is true. This year the majority opinion leader — by one — was Justice Kruger. Surprisingly, Chief Justice Guerrero’s tally fell by half compared with her first two years on the court, when she notched a dozen majorities each year.
Factors affecting time to decide and word count, 2021–25
Considering that it’s still true that opinion word counts (Figure 9) and drafting time (Figure 11) are both high and trending up, we parsed the opinion length and drafting time data by justice, vote split, type, and result. None of those factors explains the increasing opinion word count or drafting time.
Figure 13 shows the distribution of majority opinions by word count and drafting time. Each dot is a majority opinion, and each justice is represented by a different color. Note the absence of any pattern in the colors. If one justice consistently wrote longer majority opinions, or took longer to write them, a color grouping would appear in either the high or the rightward dots. Or if a justice’s opinions grew longer as they took more time to write, one color of dots would show an up-and-right linear pattern. None of that appears in this figure. The only general pattern here is that the bulk of the court’s decisions are made in under 1,000 days and under roughly 15,000 words. And there’s little mystery about which cases take longer and need more words to decide: as shown in Figure 14 below and consistent with our recent updated time study it’s the capital cases.

Figures 14 and 15 show that almost every case with a long decision time and high word count is an automatic appeal (the green dots). There is one outlier noncapital criminal case that took over 3,000 days and over 40,000 words to decide (the lone orange dot). Otherwise, as we explained in the time study, capital cases not only take the longest time to decide, but also take an increasingly longer time to decide in recent years.

Even removing the automatic appeals in Figure 15 fails to reveal a pattern.

Although the capital case distribution in Figure 14 is the clearest pattern we found among these factors, those cases are not numerous enough to explain the overall effects of increasing opinion word count and drafting time. For example, note the difference between the average and median views in Figure 11. The average is a good view when the data set has a normal distribution. But here the data set could be skewed either by the high-value capital cases or by the predominance of the noncapital cases — which are around 75% of the court’s annual decisions. Since the median often trends toward the tail of the skew (higher than the average for positive-skewed data and lower than the average for negative-skewed data) here the fact that the median is lower than the average suggests negative skew, which then suggests that the predominance of noncapital cases is the major factor. The takeaway: capital cases do take longer to decide and more words to write, but noncapital cases as the bulk of the court’s docket are the dominant factor.
Figure 16 filters the same data by result: affirmed, reversed, and partial. Here the only clear pattern is that some affirmances take longer and more words to write — but we know from Figures 14 and 15 that all but one of those are capital cases. Those cases tend to be affirmed, so there is substantial overlap between the categories of long-decision-time cases, automatic appeals, and affirmances.

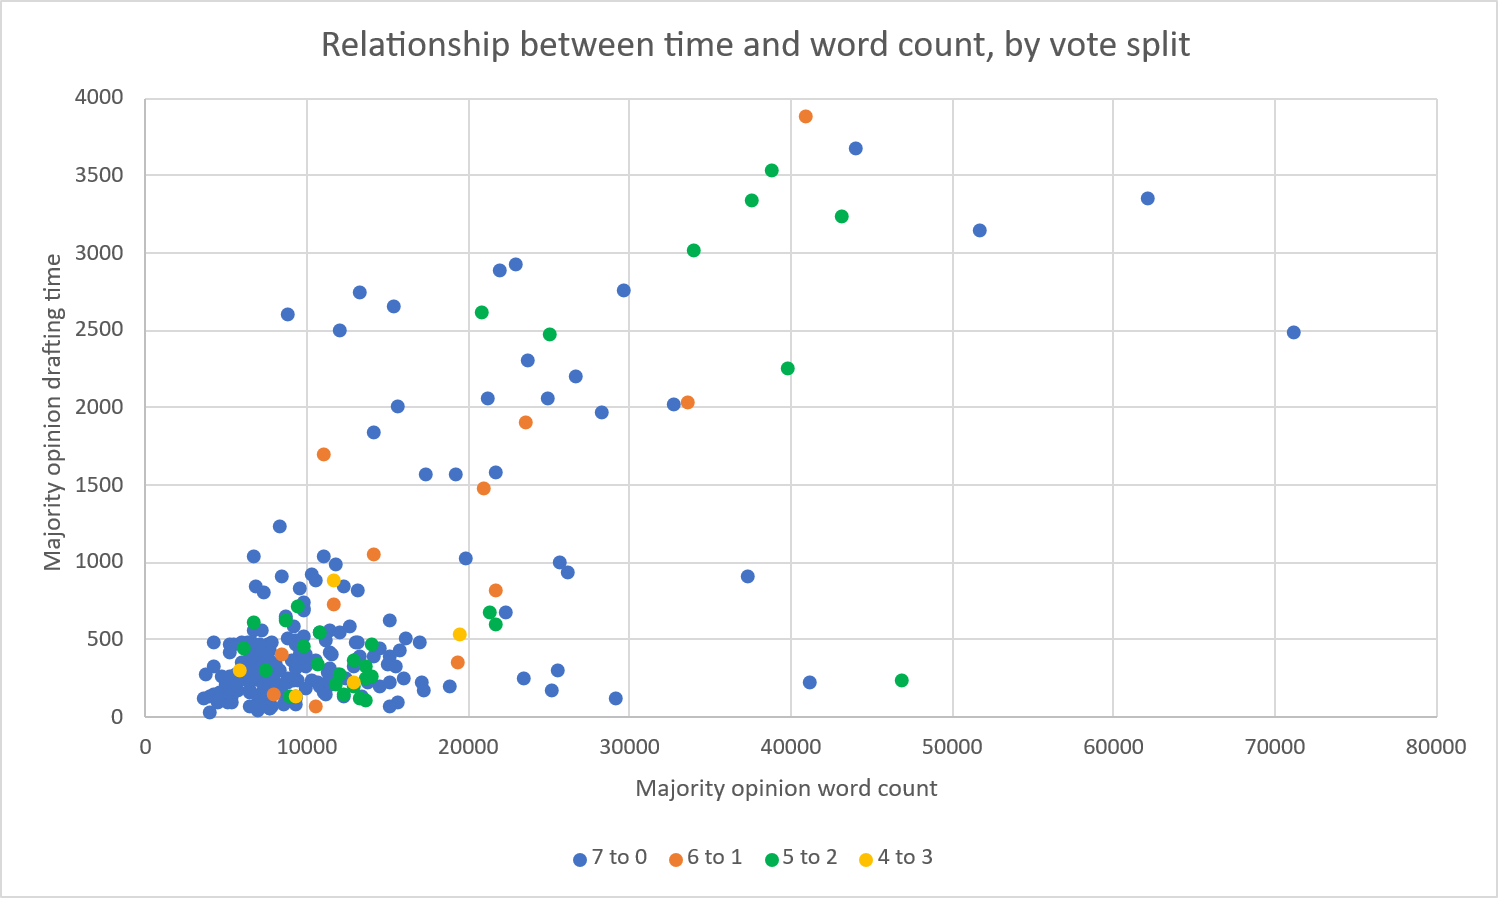
Finally, Figure 17 shows little evidence of any pattern when we filter by vote split. The only clear cluster of split types is the 4–3 cases — all under 20,000 words and 1,000 days — but all that tells us is that none of the capital cases were decided by a bare majority of four. And the handful of 4–3 splits is too small to be of much value.
The Liu–Evans axis
As we suggested last year, the primary division emerging in the court today is subject-matter-specific viewpoint differences. Were the appointing governor the determining factor, Justice Corrigan would be alone in many 6–1 decisions. But that’s not the case. On the contrary, as Figure 20 below shows, in the past five years Justice Corrigan only appears in the minority along with one of the chief justices or Justice Jenkins. That Justice Corrigan consistently partners in separate opinions with both Democratic (Guerrero and Jenkins) and Republican (Cantil-Sakauye) appointees rules out arguments about political partisanship. We think that’s a positive. Instead, a more obvious reason for those alignments is the fact of shared experience as a prosecutor or a trial judge (or both) producing similar views on certain issues. Or in the case of Liu–Evans, the lack of those experiences and divergent views.
This section discusses the strong evidence for a 5–2 Liu–Evans bloc, and the weaker evidence of a 2–3–2 pattern in justice voting: Corrigan–CJ, Kruger–Groban–Jenkins, Liu–Evans.[2] And the strongest evidence we have shows Justice Liu in a category of his own, either as a 6–1 minority or on separate opinions generally. As Figure 22 below shows he is in general a prolific writer. For example, Figure 18 shows that in 2025 he wrote the most overall opinions and is just one majority shy of Justice Kruger, who wrote most majority opinions this year.

Yet Figure 18 is typical in showing that separate opinions are a major driver for his overall opinion numbers. Figure 19 shows that in this group Justice Liu is by far the highest producer of separate opinions, of any type.
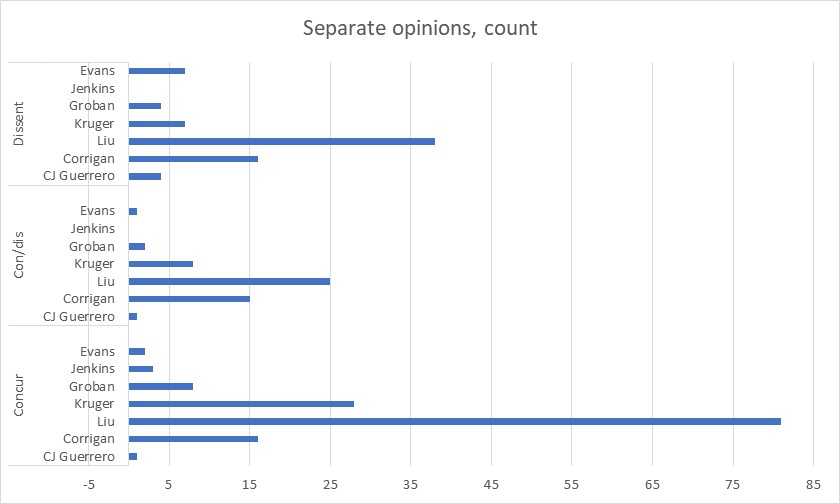
Figure 20 highlights Justice Liu’s separate opinions (the yellow bars) in a ranking of vote splits by time to decide. This shows his exceptional propensity for writing and joining separate opinions.

Next, we identified evidence suggesting an emerging 5–2 coalition with justices Liu and Evans in the minority, in criminal cases generally and automatic appeals specifically. As Figure 20 shows, when writing separately Justice Liu most often is in a 5–2 minority, less often writes alone, and least often is in a 4–3 minority.[3] When writing separately with another justice, Justice Liu most often appears with Justice Evans. We count 13 instances of a Liu–Evans appearance in 5–2 or 4–3 minorities, and 10 instances of Justice Liu with any other combination of justices when he is not alone. This is even more striking considering that these figures span Justice Liu’s entire time on the court since 2011, while Justice Evans has only been on the court for the past three years. In that brief time Justice Evans has agreed in the minority with Justice Liu more often than all other justices combined. Figure 21 highlights those Liu–Evans pairings (the red bars) in separate opinions in the same ranking as Figure 20 of vote splits by time to decide.

Figure 21 also somewhat supports an argument for a Corrigan–CJ bloc — pairing her with either former Chief Justice Cantil-Sakauye or current Chief Justice Guerrero. This is consistent with our point about viewpoints being the driver here, not political affiliation. As Figures 20 and 21 show, although both chief justices and Justice Corrigan appear in minorities with each other, they never appear with justices Liu or Evans. Instead, the chief justices and Justice Corrigan appear either together or with justices Groban or Jenkins. Given how many of the split decisions are in automatic appeals or general criminal cases, it makes sense that former prosecutors Cantil-Sakauye, Guerrero, Corrigan, and Jenkins would be aligned on the issues in those cases. The takeaway is that (depending on the case type) the rough divisions are Guerrero–Corrigan on one end, Liu–Evans on the other, and Kruger–Groban–Jenkins in the middle. Of course, whoever replaces Justice Jenkins could scramble this pattern.
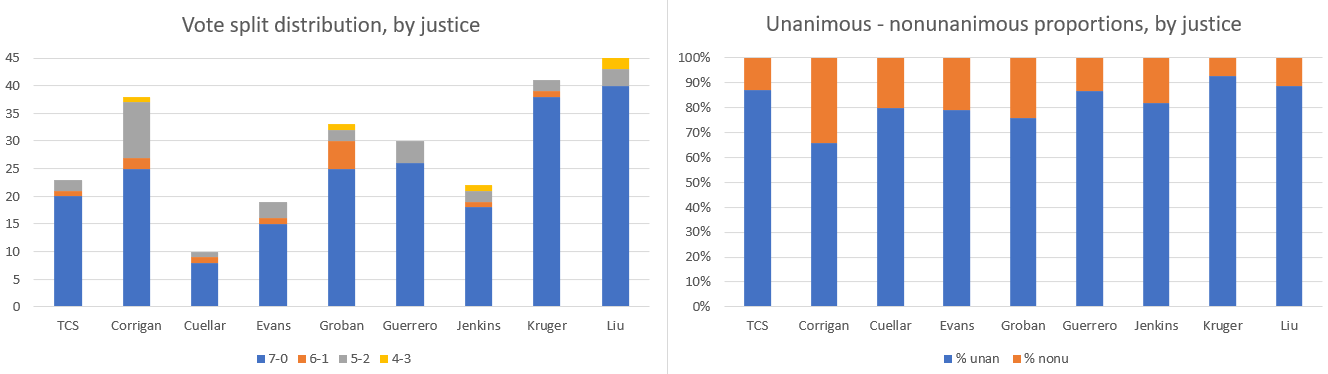
Note that, given his high number of majority opinions, it would be wrong to characterize Justice Liu (alone or with Justice Evans) as a modern version of the court’s great dissenter Justice Jesse Carter. This is at least because Justice Liu’s many majority opinions tend to be unanimous — even more so when compared with the higher nonunanimous proportions of the majority opinions written by other justices. Figure 22 shows the vote splits and unanimity proportions by justice, showing that Justice Liu ranks either first or second for how often the whole court endorses his majority opinions.
The futile hunt for Justice Slow
Finally, in the ongoing search for something objective that explains the court’s output slowdown, we looked for evidence that someone was holding up the show. We hypothesized that one justice (codenamed “Justice Slow”) was jamming the court’s entire process by sitting on draft opinions, either majority or minority. Evidence of this could be a combination of factors. If for example majority opinions always have longer drafting times when a particular justice authors them, or the same is always so when that justice is in the minority. This turned out to be a snark hunt.
With his many opinions (majority and separate) Justice Liu seemed at first a likely candidate — producing many opinions slowly could have a large aggregate effect. But Justice Liu most often writes separately in automatic appeals, which we already know take the longest to decide in general. Figure 23 highlights Justice Liu (the blue bars) ranks time to decide by case type, and shows that (except for that one criminal case) there’s no obvious time pattern in the noncapital cases where Justice Liu is in the minority.
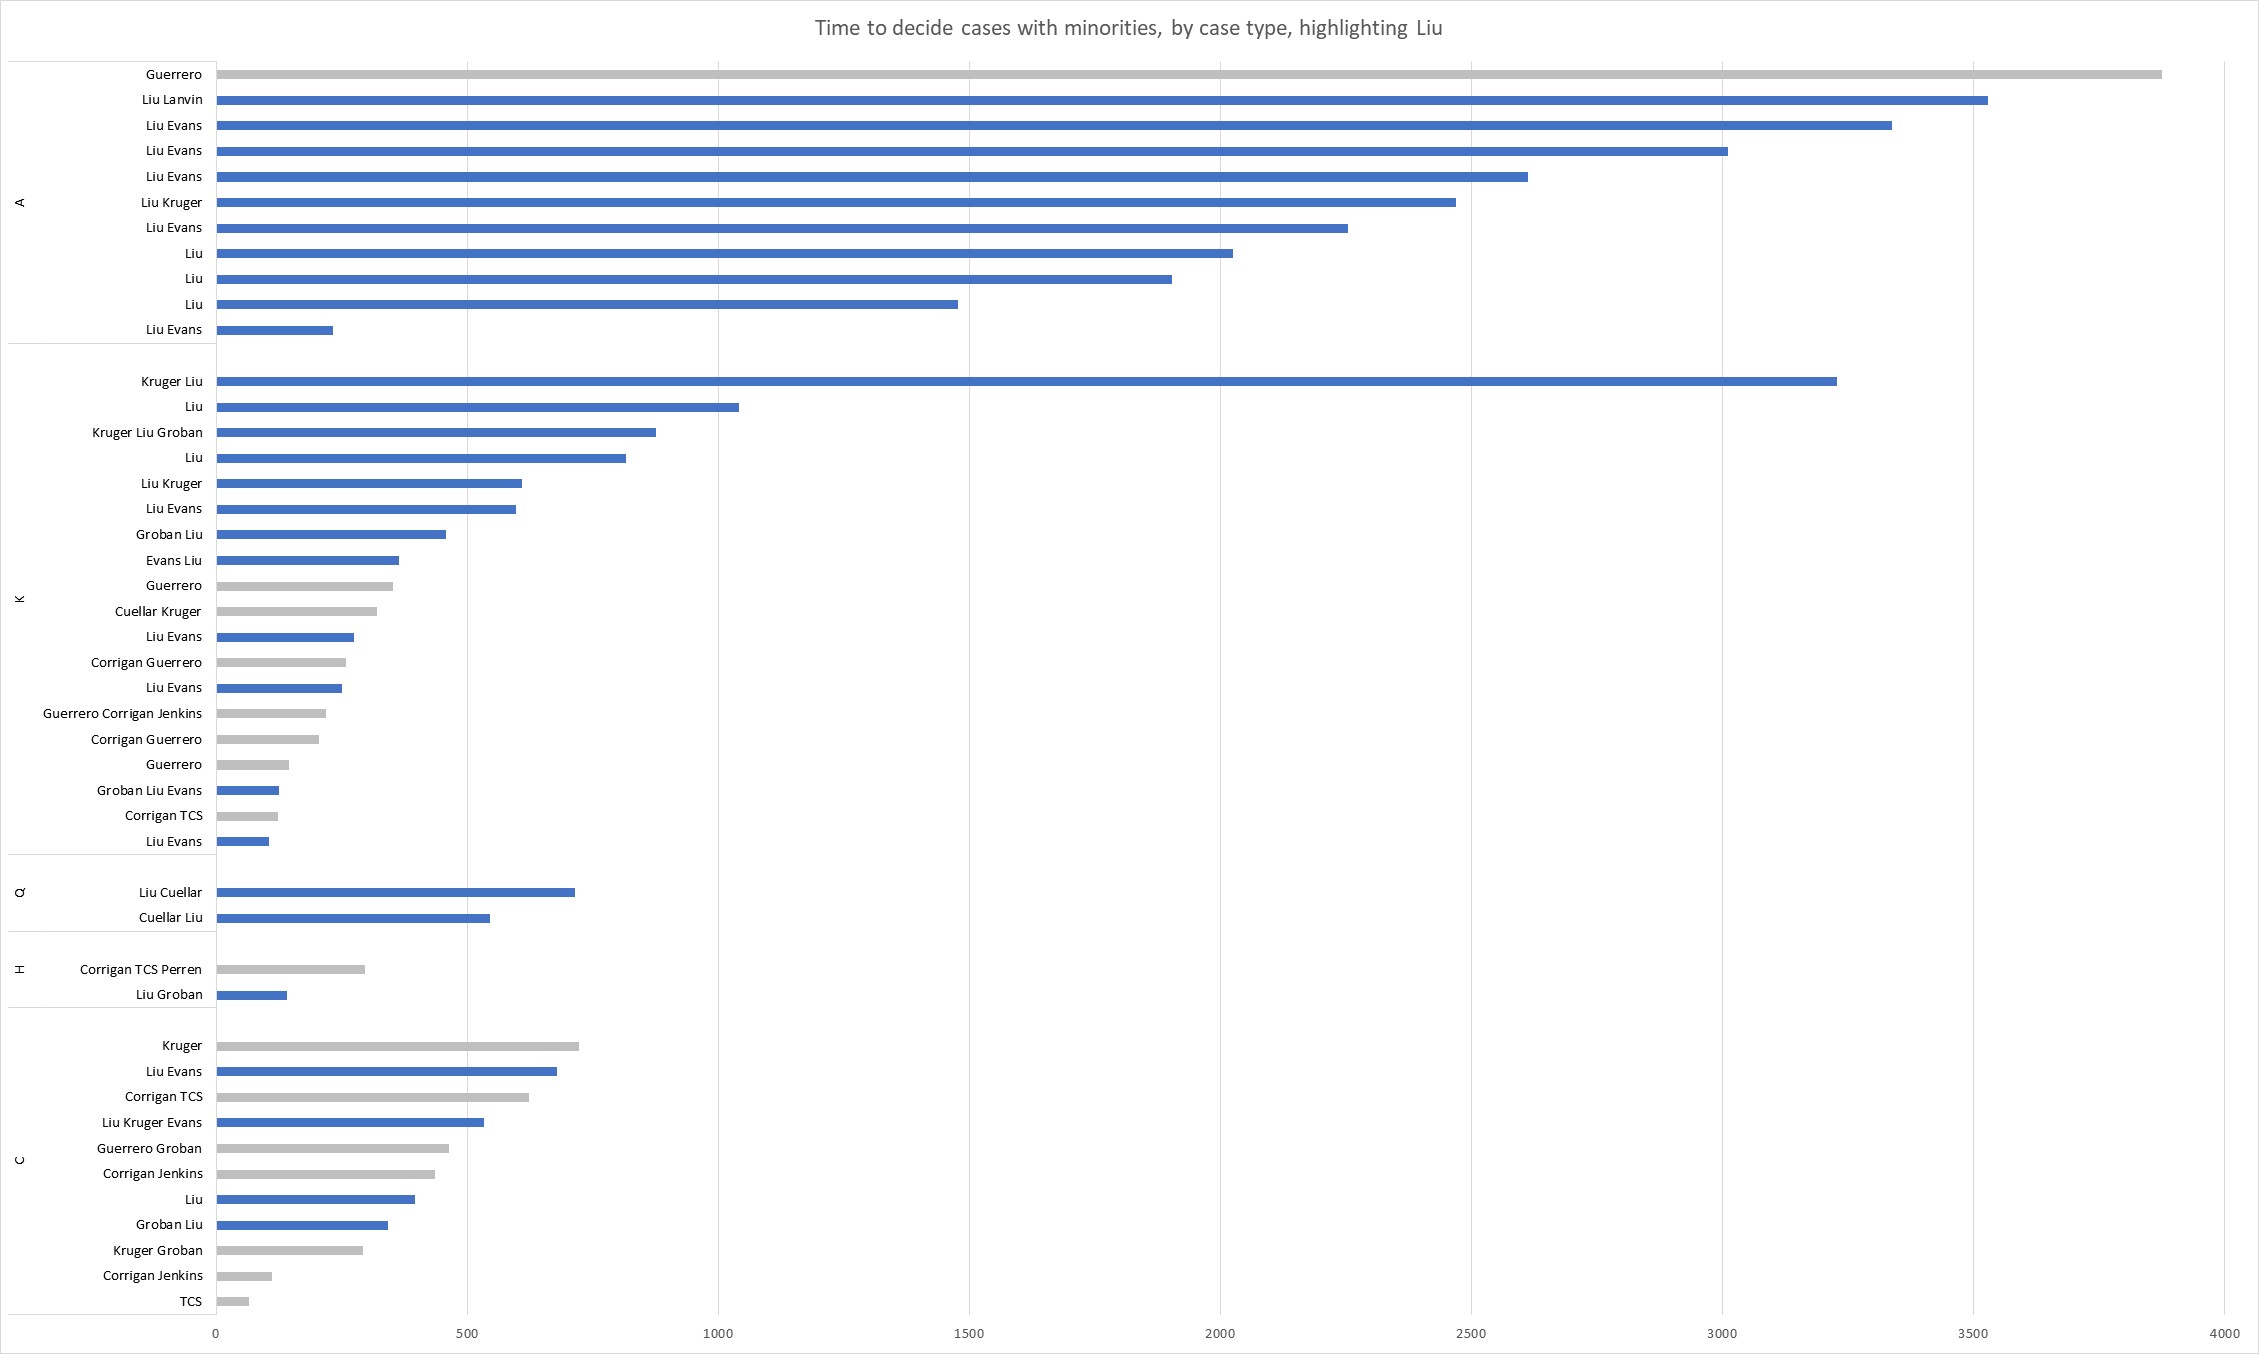
Overlaying Figure 20 with the case types shows that all the longest-decision-time cases are automatic appeals or criminal cases, and Justice Liu appears in the minority in nearly all those cases. And there are no 4–3 splits in automatic appeals, highlighting our point above about the 5–2 Liu–Evans split appearing most clearly in the capital cases. But other than the correlation between subject matter and a Liu minority vote we can’t conclude that those separate opinions caused those majority opinions to take longer to write.

The takeaway here is that case type appears to be the primary driver of decision time, not who writes separately. And although this overlay correlates Justice Liu’s separate opinions with the longer decision times in automatic appeals, the fact of those separate opinions does not necessarily make those cases take longer to decide. It would be perverse to blame someone in the minority for delays in drafting the majority opinion. Instead, this is (at most) further evidence for the conclusion that Justice Liu has distinct views, most obviously in criminal law generally and automatic appeals specifically. And this data view is consistent with our argument that viewpoint on particular subjects is the better explanation for justice voting patterns than appointing governor or political party affiliation.
We also looked in the other direction: it could be that the hypothetical Justice Slow writes few opinions slowly. Here we found even less evidence and weaker correlation. Figure 25 plots the relationship between each justice’s majority opinion output, corrected for tenure. Each dot represents an individual justice’s values. A high-and-right value shows many opinions and long drafting times; a low-and-left value shows few opinions and short drafting times. A pattern showing correlation here would be for example a high-left to low-right diagonal distribution with some justices writing few opinions slowly and others writing many opinions quickly. Figure 25 shows that’s not so.

Indeed, this shows neither a positive nor a negative correlation pattern. Justices who write fewer majorities are not necessarily faster or slower to produce them, and the same is true for justices who write more majorities. Absent a clear correlation between opinion numbers and speed we cannot conclude that anyone is Justice Slow.
Seat changes
Justice Jenkins retired in October 2025, leaving his seat open for Governor Newsom to fill. Odds are that an announcement will be made in early 2026, with a JNE Commission and CJA hearing sometime in the spring. Justice Jenkins was elected to a new 12-year term in 2022, so whoever replaces him will stand for election to the remaining eight years of his term in November 2026 (assuming they are confirmed in time for the fall ballot) and will stand again for a new full term in November 2034. No justices were up for retention in 2025. The next ballot appearances are as follows:
- In this year’s November 2026 gubernatorial election Justice Evans will be on the ballot for retention and Justice Groban will stand for a new full term.
- Justices Corrigan and Kruger will both next be on the ballot in November 2030.
- Chief Justice Guerrero and Justice Liu will next appear on the ballot in November 2034.
How the new justice affects the patterns we identified above in the court’s nonunanimous decisions will bear close attention in the next few years.
Looking ahead
What’s striking about this year was the dogs that didn’t bark: the Racial Justice Act case (In re Montgomery S287339) was dismissed, and the death penalty (OSPD v. Bonta S284496) and court reporters (FVAP v. Superior Court S288176) cases are delayed with supplemental briefing. Merits decisions in either of those cases would be big news in 2026. And of course the key question in 2026 will be who gets appointed to fill the empty seat. Given the prospects for the court’s opinion output falling even lower this year, maybe a new justice can shake things up on that front.
—o0o—
Senior research fellows Stephen M. Duvernay and Brandon V. Stracener contributed to this article.
Note that these figures only cover up to fiscal 2024 because they rely on Judicial Council annual reports. The latest 2025 Court Statistics Report spans 2014–15 through 2023–24. ↑
Most figures in this section do not include People v. Kopp (S257844). By our coding method it was a 6–1 split, but the concurring-and-dissenting justice was a pro tem. Because justices Liu and Evans signed the majority opinion, their concurring opinion does not count in the vote split. Even if it did, Kopp would only add support for our argument in this section about the Liu–Evans axis. ↑
In Hoffman v. Young (2022) 13 Cal.5th 1257 Justice Liu signed both the majority and Justice Kruger’s concurring opinion, which is a 5–2 split in our coding system because she does not expressly concur with the judgment. This case consequently appears as a Kruger–Groban bar in the 5–2 range in this figure. ↑