Appellate rules of thumb


Overview
Experienced California appellate practitioners sometimes rely on two rules of thumb. One posits that when the California Supreme Court grants a petition for review, the court reverses about 60% of the time and affirms the other 40% of reviewed cases; call this the “60–40 rule.” The other bit of conventional wisdom (call it the “rule of thirds”) holds that the court’s docket is divided roughly into thirds: about one-third each of automatic capital appeals, general criminal, and general civil cases. In this article we evaluate these hypotheses. We found that the rule of thirds is inaccurate: at least 40% of the court’s docket is civil cases, general criminal is about one-third, and automatic appeals are about a quarter. Our analysis validates the 60–40 rule: the court reverses in whole or in part about 60% of its cases, and affirms in the other 40%.
Methodology
From the center’s existing list of all merits decisions from 2010 to 2022 we coded for subject: civil, habeas, noncapital criminal, and automatic appeals. And we coded each case for result: reversed, affirmed, and a combined “in part” category that captures both partly affirmed and partly reversed. We relied on the Westlaw case summary for the results — which in our experience is not 100% accurate. But given how broad our categories are we can accept the small risk that a Westlaw editor might erroneously describe a reversal as an affirmance. We assigned the subject code based on our own evaluation of the case description.
We omitted anything that did not involve reviewing a Court of Appeal decision: for example, certified questions, original writs, and original jurisdiction matters. This removed just a few cases each year, and we adjusted the yearly totals to account for these omissions so the proportions in the graphics here also exclude those cases. Given the debate about how grant-and-holds should factor into measuring the court’s output, we excluded them in this analysis; that issue is discussed here, here, and here in depth. The categories are necessarily broad, and required some judgment calls. For example, we classified only the automatic merits appeal as a capital case and any other non-merits issue that arose from such matters as either general criminal or habeas as appropriate. We also coded habeas petitions separately and consider them to be a non-material component given how few they are. This gave us a final dataset of 958 cases.
Analysis
The rule of thirds is somewhat inaccurate
Of the nearly one thousand cases we evaluated, about a quarter were automatic appeals, about a third were general criminal, and 40% were general civil. This shows that the rule of thirds is inaccurate, because it underestimates civil cases and overestimates automatic appeals. (This also excludes the small slice of habeas petitions, which only account for about 2% of the court’s total output.) With the uneven distribution across the three primary categories, the rule of thirds is at best a rough estimate. Figure 1 shows the exact distribution; note that the percentages are rounded for all figures herein.
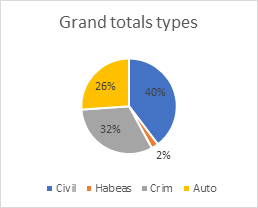
Figure 1
This does, however, validate another rule of thumb: that capital cases are about 25% of the court’s docket. This supports public statements by past chief justices Ronald M. George and Tani Cantil-Sakauye to that effect.[1]
We were surprised to see that civil cases overall are a substantial 40% of the court’s docket. And as Figure 2 shows, civil cases are a clear majority of the non-capital docket.
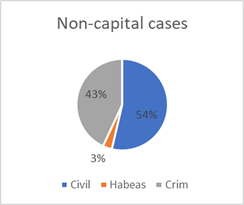
Figure 2
This allows us to conclude that the rule of thirds is rather inaccurate, because civil cases are a robust 40% or even 54% of the court’s work. On the other hand, the court’s often-stated estimate that capital cases are about 25% of the court’s opinions is quite accurate. The takeaway is that civil cases are a much larger portion of the overall docket, and certainly of the discretionary docket, than the conventional wisdom assumes.
The 60–40 rule is quite accurate
Our initial results seemed to refute the hypothesis that the court reverses 60% of the time and affirms the other 40%. Figure 3 suggests something like the opposite: considering all cases, the court only reverses around 40% of the time, and about 50% of its decisions are affirmances.
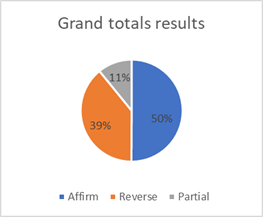
Figure 3
There’s also a glass-half-full question here: depending whether one counts the partial result as “partly affirmed” or “partly reversed,” Figure 3 suggests that about 60% of the court’s cases are affirmed in whole or in part. That’s the inverse of the usual 60–40 rule.
We think this is explained by the fact that 81% of the automatic appeals are affirmed. That’s much higher than the affirmance rate for criminal and civil cases (51% and 53% respectively), which skews the overall result. The tiny fraction of habeas cases mirrors the other non-capital cases with a 52% affirmance rate, so we would include those cases in the noncapital category. If we omit all automatic appeals and view only noncapital results, as in Figure 4, the 60–40 rule of 60% reversals and 40% affirmances comes into focus.
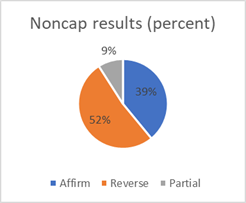
Figure 4
We read this as a given noncapital case’s odds of being affirmed are about 40%, and a reversal in whole or in part is about 60%: viewing the partial results as “reversed in part” provides a clear 60% reversed (in whole or in part) and 40% affirmed result, validating the rule of thumb. If you’re a glass-half-full sort of person, the alternate view is that it’s more 50–50: the odds of a reversal are about 50% and an affirmance in whole or in part is about 50%. Regardless, even if one counts partials as “affirmed in part,” reversals are still the majority, so the upshot is that for any noncapital case a grant of review means better-than-even chances of a reversal in whole or in part.
Change over time
We plotted each result over time to track changes in their relative proportions. Figure 5 suggests a few conclusions. One is that a partial result is usually a 10% scenario: the court is far more likely to reverse or affirm outright, sometimes with instructions. The apparent decline in affirmances in the raw totals is not evidence that affirmances are declining; this instead is caused by the decline in annual opinion totals in this period. The percent proportions show affirmances remaining fairly constant in this period.
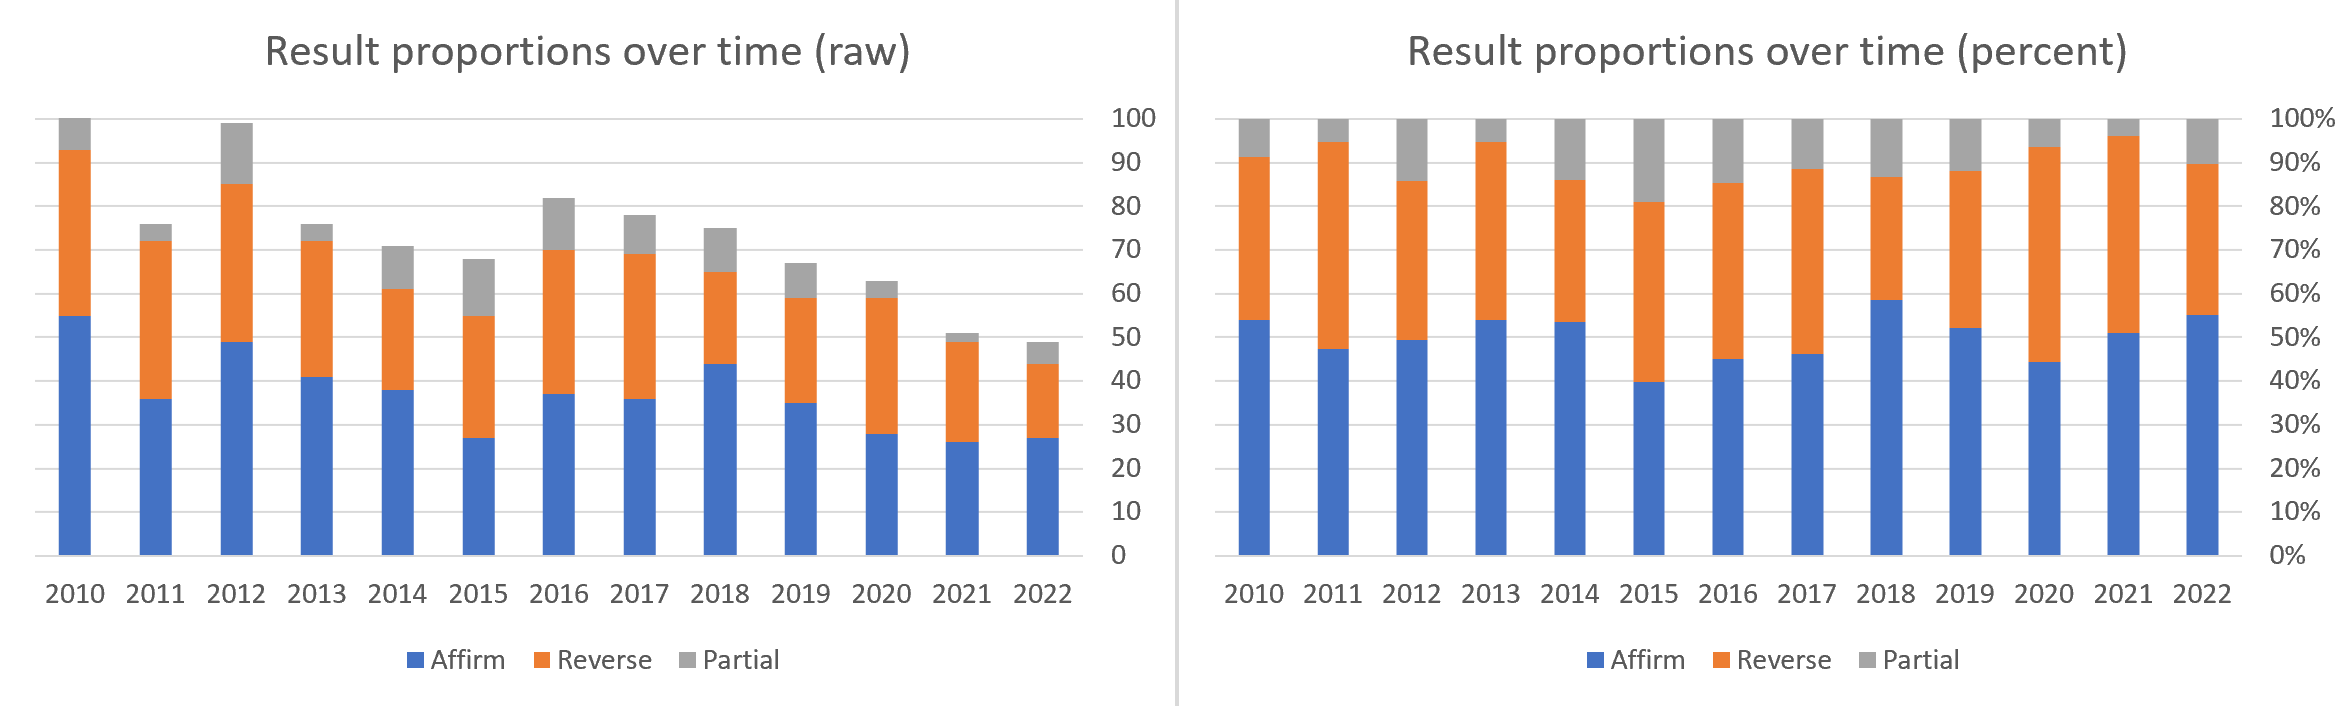
Figure 5
If anything, we see no clear trends over time. Consistent with the discussion above regarding the 60–40 rule, viewing all cases in Figure 5 shows affirmances outnumbering reversals in most years. To remove the effect of the high automatic appeal affirmance rate, we again calculated the proportions over time for all noncapital cases in Figure 6.
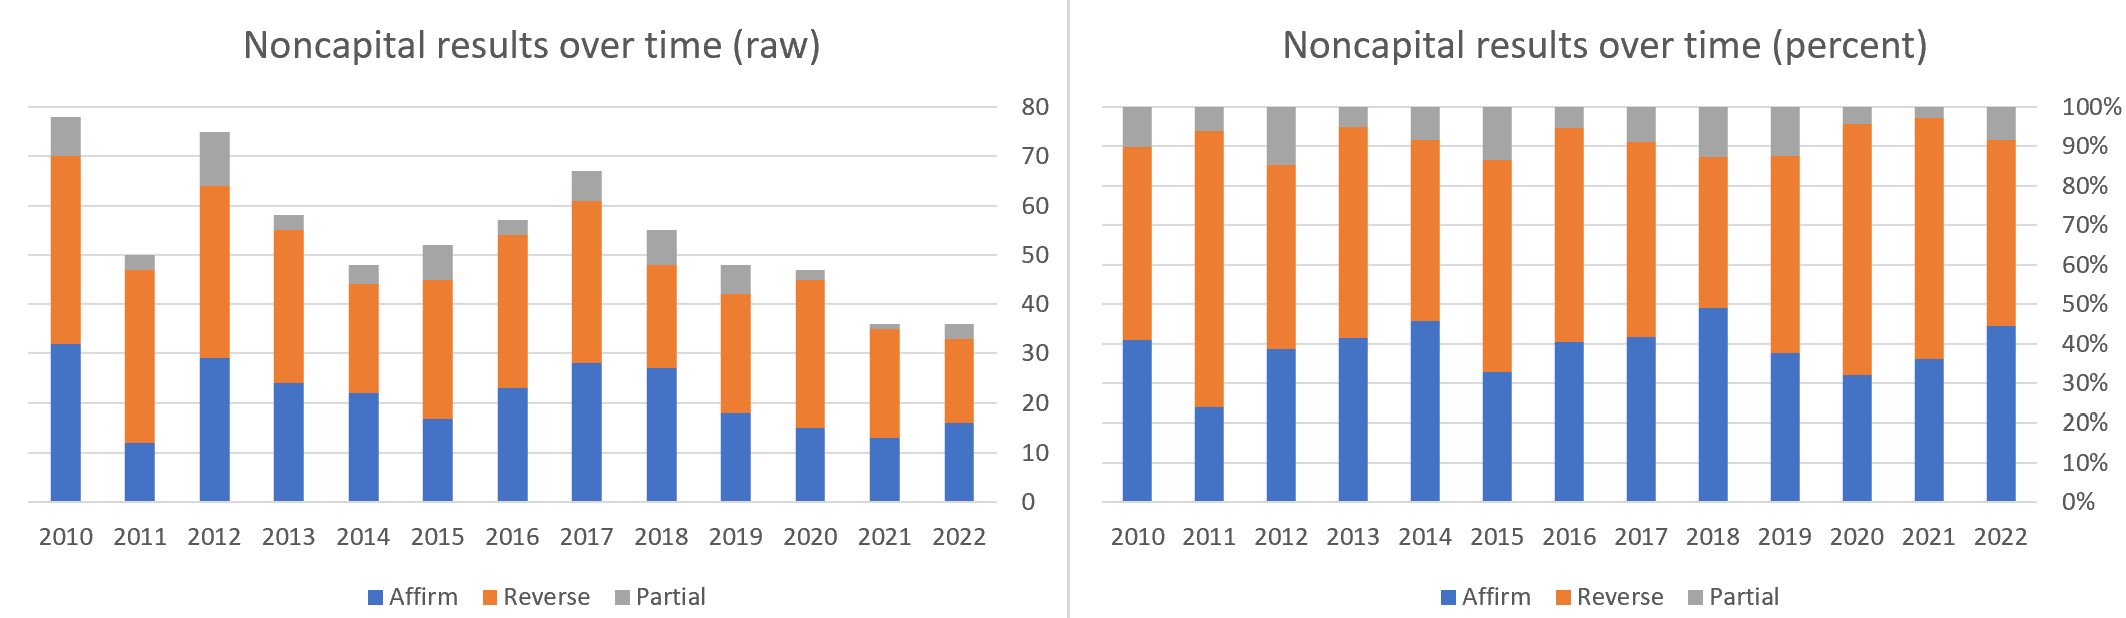
Figure 6
Consistent with the discussion above regarding the 60–40 rule, removing automatic appeals reduces the raw proportion of affirmances, but the proportion of affirmances remains fairly constant over time, showing no clear trend in any direction. Again, the raw figures decline only because the overall number of cases considered falls during this period; the percent affirmance remains relatively steady.
The lack of change in case proportions is particularly interesting given that automatic appeals are declining.[2] Figure 7 (from the Judicial Council’s 2023 Court Statistics Report) shows that incoming new capital cases have fallen substantially in the past decade (the period we evaluate here), and capital habeas petitions have plummeted.
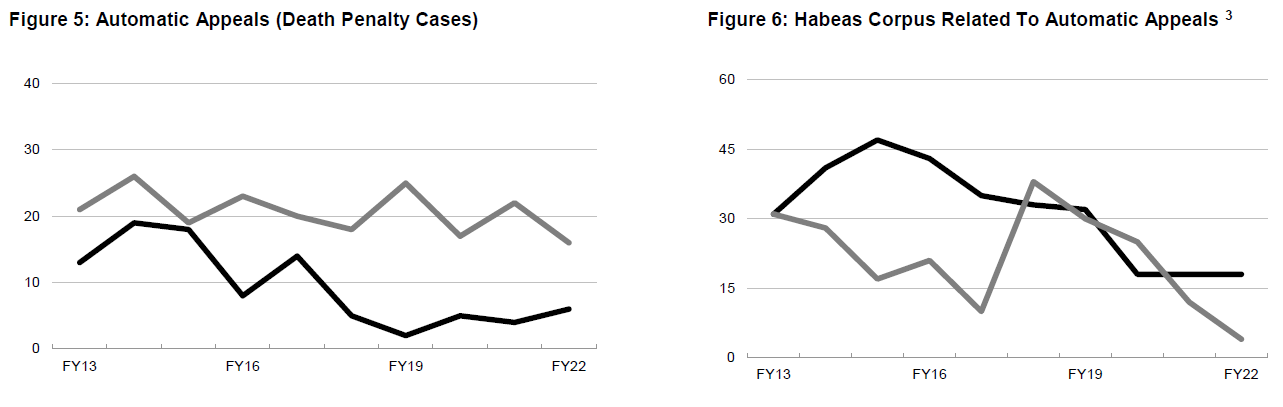
Figure 7 (gray lines are dispositions, black lines are filings)
Figure 8 suggests that the court’s annual raw disposition total for capital cases has been cut in half over the past decade: from around 25 cases in 2010 to around 13 cases in 2022. Consistent with that view, the trend for the court’s resolution of automatic appeals declines in both the Judicial Council’s graphic in Figure 7 and our calculation in Figure 8 below. This likely is because the court’s overall opinion output trends down in this period.
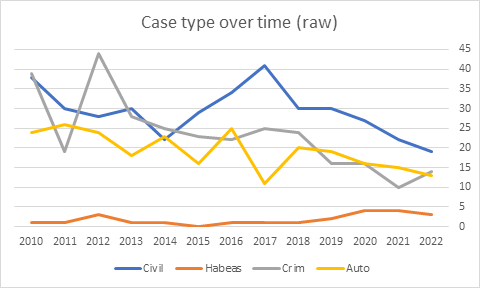
Figure 8
If the court were staying on pace with the incoming automatic appeals, or if it continued to dispose of around 25 capital cases annually, one would expect the case type proportions in the overall docket to change, with automatic appeals gradually taking a smaller role due to the falling numbers of new incoming automatic appeals. But that’s not the case — as Figure 9 shows, proportionally automatic appeals are staying rather consistent with the 10-year average of 26.33% of the whole docket.
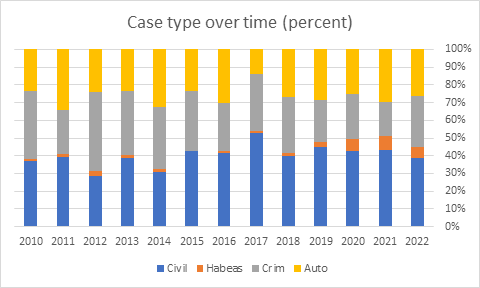
Figure 9
This is also consistent with the falling overall annual opinion output: the court is maintaining its rough subject-matter distribution even as it issues fewer decisions. If incoming automatic appeals remain steady or continue to fall, at some point the court may resolve its capital case backlog and approach a 1:1 ratio of incoming to outgoing automatic appeals. That’s even more likely if the court rebounds from its historic low annual opinions in the past two years. Assuming that automatic appeals continue to be 25% of opinions, and that incoming new capital cases remain low or fall even further, any increase in the court’s overall annual opinion output should further reduce the backlog. This is a startling prospect, given that as recently as 2008 Chief Justice George voiced concerns about the California Supreme Court becoming “solely a death penalty court.”[3]
The takeaway here is that each case type remains fairly constant as a proportion of the court’s overall output, even when the total number of annual opinions falls. And when the incoming cases in a category are fewer than the outgoing opinions, eventually the court will clear its backlog and approach parity. The question for future examination is whether this is only a temporary dip in new capital cases, or if outgoing opinions continue to outpace incoming automatic appeals.
Conclusion
This small study is only a snapshot of how the court is behaving now and in the recent past. Without including previous decades we could not speculate about how the court’s case types or results have changed (or not) over a longer period, nor could we compare the current figures with the court’s past activity. This study says nothing about how the current court’s performance compares with its past, and we hesitate to predict the future based on assumptions about current trends continuing. At least for now, the 60–40 rule of reversals being more likely appears to be true, and the rule of thirds is not very accurate.
—o0o—
Senior research fellows Stephen M. Duvernay, Quinn Keefer, and Kira Klatchko contributed to this article.
-
See, e.g., Scott Shafer, “California’s Chief Justice: Hard to Say the Death Penalty Is Working,” KQED January 23, 2015; Don Thompson, “Justice says state’s reviews of death sentences dysfunctional,” Lodi News January 10, 2008; The Stockton Record, “State’s chief justice speaks in Stockton,” May 23, 1997. ↑
-
For a quick overview of the death penalty’s evolution in California, see Luis Gomez “A short recap of California’s long history with the death penalty,” San Diego Union-Tribune, March 13, 2019. ↑
-
Chief Justice Ronald M. George, testimony before the Commission on the Fair Administration of Justice, January 10, 2008. ↑