SCOCA is spending more time writing fewer and longer decisions
Overview
The California Supreme Court is taking more time to decide fewer cases, and its majority opinions are getting longer. In the past, when the court was writing shorter majority opinions it did so faster and produced more of them. The current condition in general stems from trends in automatic appeals and civil cases, with each case type showing distinct contributing effects. These general and specific trends are most pronounced after recent trend inflections revealed significant distinctions between the case types. The court is deciding fewer automatic appeals and taking much longer to decide them. But these decisions are not getting longer. The court is deciding even fewer noncapital cases, at about its regular pace. And these decisions are getting longer. Thus, there is no direct correlation between the court’s overall productivity and either its drafting time or its opinion word count — the effects we see are instead case-type-specific. It’s only in combination that these distinct effects produce the general condition of fewer decisions, which take longer to decide, with longer opinions.
Summary of conclusions
- Time to decide: The court is taking longer to write its decisions. The greater overall time is almost entirely due to increasing decision times in capital cases. Time to decide automatic appeals has greatly increased since 2015, while noncapital case decision times have remained relatively consistent.
- Case count: The court is issuing fewer decisions annually. This decline in output is primarily caused by a substantial decline in the number of noncapital decisions. Although automatic appeals have fallen from a high of 45% of all annual decisions to less than 10% of the court’s annual decisions, the number of noncapital decisions has decreased even more than capital cases have. The volume decrease for noncapital cases outweighs the proportional decline in capital cases.
- Word count: The court’s majority opinions are getting longer. Viewing the whole 1998–2024 study period, capital cases are the primary factor in annual total word count. But due to recent changes, automatic appeals have fallen from a high of 60% to around 20% of the court’s annual word count. The primary factor now is increasing length in noncapital cases, civil cases in particular.
- Therefore: presently the noncapital docket is the main driver of the court’s falling decision output and the rising annual decision word count, while the automatic appeals alone are chiefly responsible for the court’s increasing average decision time.
Methodology
We updated the dataset and analysis discussed in our 2023 study to revisit it and also to evaluate the findings in this recent study. Our questions were:
- Is the court spending more time on its internal drafting process? If so, which case type is the primary factor?
- We know that the court is issuing fewer decisions. Does that correlate with changes in any case type?
- We know that the court’s majority opinions are getting longer. Which category of cases is causing that?
- Do longer opinions take longer to write?
- How much blame does the capital docket get for any of this?
Our dataset included all merits decisions from 1998 to 2024, comprising around 2400 cases. As in our 2023 study, for the decision time value we focused on the interval from last brief filed to ordered on calendar, which is measured by counting the days from the last party’s merits reply brief to the first on-calendar notice. We calculated the per-year average, median, and standard deviation, and compared 1998–2016 with 2017–24 to highlight the effect of changes in 2015–16 to the court’s grant-and-hold policy and to its oral argument warning letter procedure.[1]
For case-type values we coded initial direct merits review of death verdicts as automatic appeals, any other criminal matter as criminal, any non-criminal matter as civil, along with small categories for habeas, original jurisdiction writ petitions, and certified questions. Some figures here distinguish only at the macro level between automatic appeals and everything else; others parse case types more finely. We excluded a handful of cases that were impossible to categorize.[2]
For word count values we used Microsoft Word’s x of y word-count feature to capture only the word count of the majority opinion in each case, from the name of the authoring justice to the end of the disposition paragraph, including footnotes and stopping before the signatures.
Analysis
Compared with its past performance the California Supreme Court is issuing fewer opinions overall, taking longer to do so, and those opinions are on average longer. This of course has occurred as the court’s unanimity rate steadily increased over the past 25 years. Yet drawing conclusions from those overall figures would be inadequate given the unique features of automatic appeals. Parsing case type performance rather than the court’s performance reveals the nuance: the overall effects are caused by a combination of factors unique to the case types we examine here.
Overall performance trends
Considering all case types together, Figure 1 shows that both the average and median decision time increase over time. These increases support our overall conclusion that in general and over time the court is taking longer to decide its cases.

We evaluated and ruled out the possible effect of the other time increments involved in the court’s process. For example, we measured the time value from the warning letter to the on-calendar notice. This is not a reliable metric because the court did not consistently issue these warning letters before 2017. From the data that does exist, as Figure 2 shows the additional time proved to be negligible. This increment does increase slightly over time, but only from around one month to perhaps two or three months, so it amounts to at most a minor incremental increase over the last brief filed to ordered on calendar interval we focus on here. And given the practical reality that the court only issues the first warning letter when its calendar memo is ready, this time value primarily measures scheduling rather than drafting time, with the latter factor being the one we care about.

We refreshed our look at the effect of the two procedural changes that coincided in 2015 and 2016. To briefly recap, in 2015 the court changed its grant-and-hold policy (explained in more detail in our 2022 year in review article) to hold groups of related petitions for decision by one lead case, rather than denying petitions for review in cases that raised the same issue as a lead case. And around the end of 2016 the court began issuing warning letters in all cases, not just in capital cases. Figure 3 compares the whole study period, with only 1998–2015, and with only 2016–24 to highlight the effect those changes had. The apparent effect is that the average and median decision time increased after the changes.

Finally, we considered the potential effect of outliers on the overall results. After all, capital cases are well known for their long lead times and lengthy decisions. Figure 4 shows the standard deviation and the error bars produced by including that metric. The error bars show that there are indeed substantial and consistent high-end outliers. Figure 4 also suggests that the outliers are increasing in magnitude. Suspecting that the automatic appeals were at fault, we sorted the data based on case type and examined their respective values for time to decide, case count, and word count. The next sections describe that analysis.

Time to decide: yes, it’s the capital cases causing the increase
As Figure 5 shows, the annual average and median decision times for automatic appeals are in general consistently higher than those values for all other case types, with a consistently greater increasing trend, and with a recent major positive inflection. This likely explains the post-2016 rule-change increase in the overall figures above: while the noncapital cases remain relatively unchanged, the automatic appeal values show a marked trend change that coincides with the court’s procedural changes. Those changes appear to have substantially increased the court’s time to decide automatic appeals — but only in the capital cases.

For another view of this result, Figure 6 compares the relative magnitude of the overall annual averages and medians against the automatic appeal values. In contrast to the modest change over time in the total results, the capital case results show far greater change, becoming a proportionally greater share of the total over time.

Figure 7 compares the relative magnitudes of the automatic appeal values with the noncapital case values. This shows that the capital case decision time changes at a greater rate than the noncapital cases, which exhibit little variation over time.

Figures 5–7 validate the assumption that capital cases take longer to decide in general. What’s novel here is the evidence of a major increase in the time to decide capital cases that coincides with the 2015–16 procedural changes.
The long decision times particular to capital cases show up in other ways. Assume (as the next section will show) that capital cases have declined, both in number and as a proportion of the court’s annual case count. If so, one expects fewer instances of long-decision-time values each year. Figure 8 shows that the high-value data points indeed are few, but what’s more notable is how their y-axis values increase over time. (Figure 8 also shows the whole-period average line of about 417 days.) This result suggests that the cases that take longest to decide are taking longer to decide.
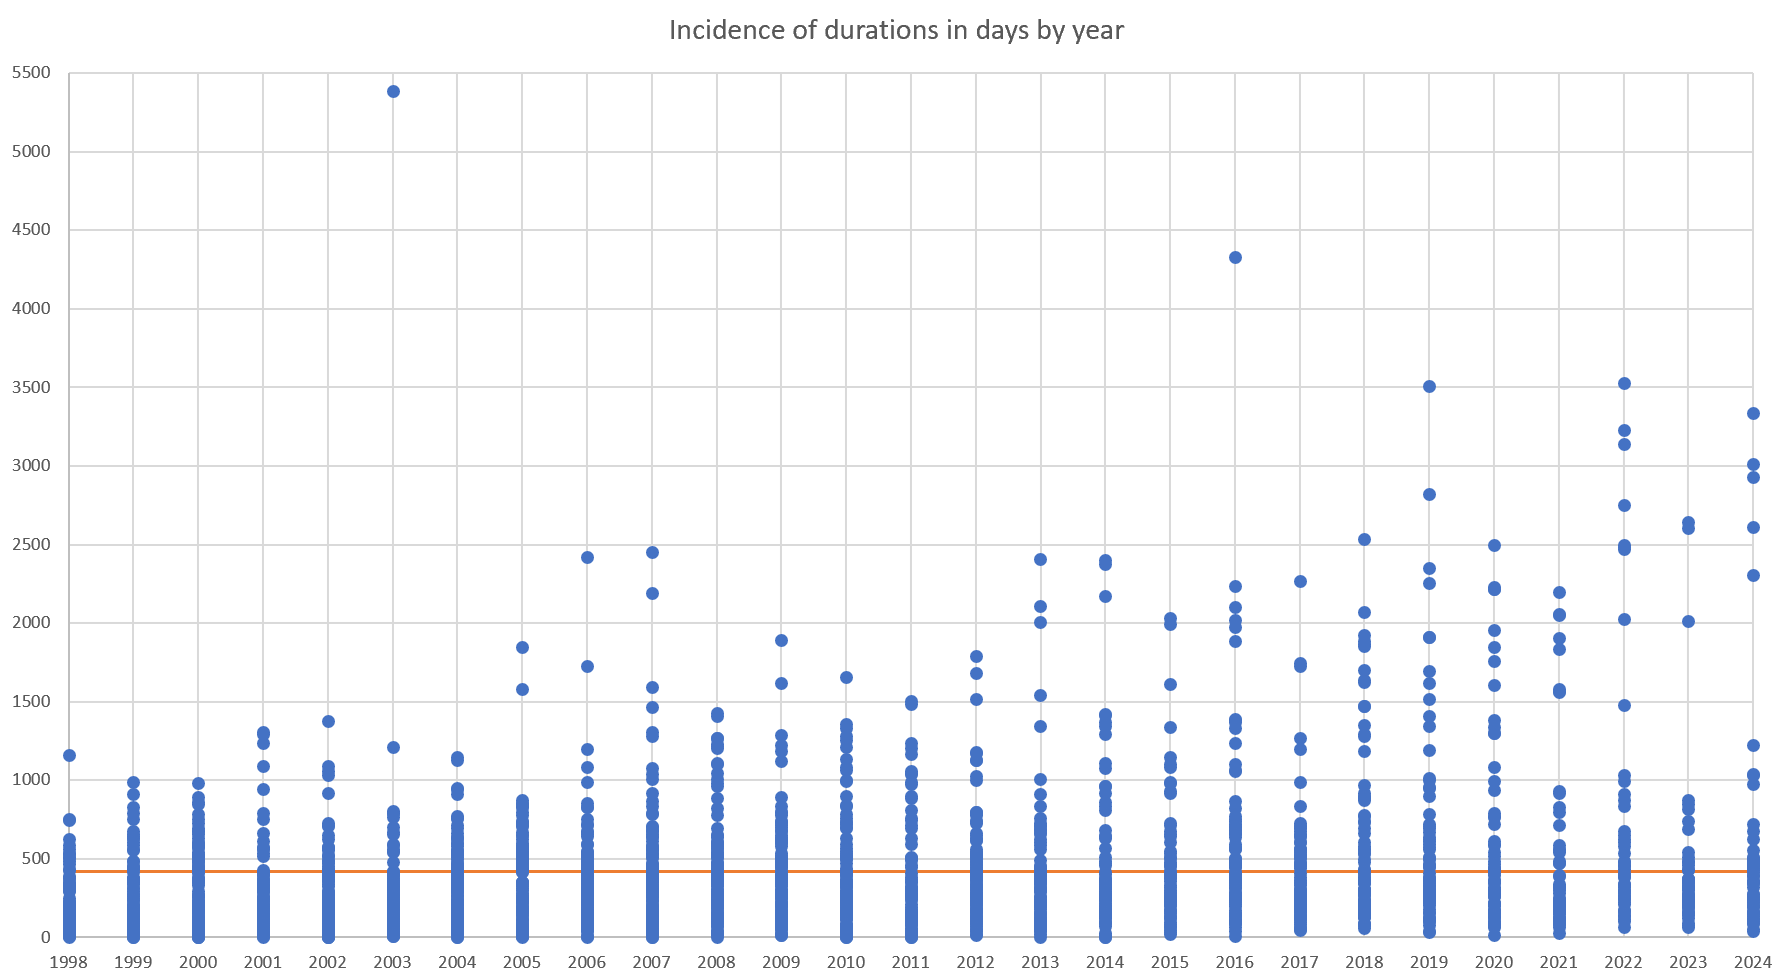
Given what we know about increasing capital case decision times from Figure 5, and the below-500-days average and median values for noncapital cases, all the over-1000-days values in Figure 8 should be from automatic appeals. Note also the general upward trend in those over-1000 values. This explains why the error bars in Figure 4 above generally increase: it’s because the automatic appeal time values increase and multiply over time. The box plot outliers (the dots) in Figure 9 show much the same: they increase in number and magnitude over time.
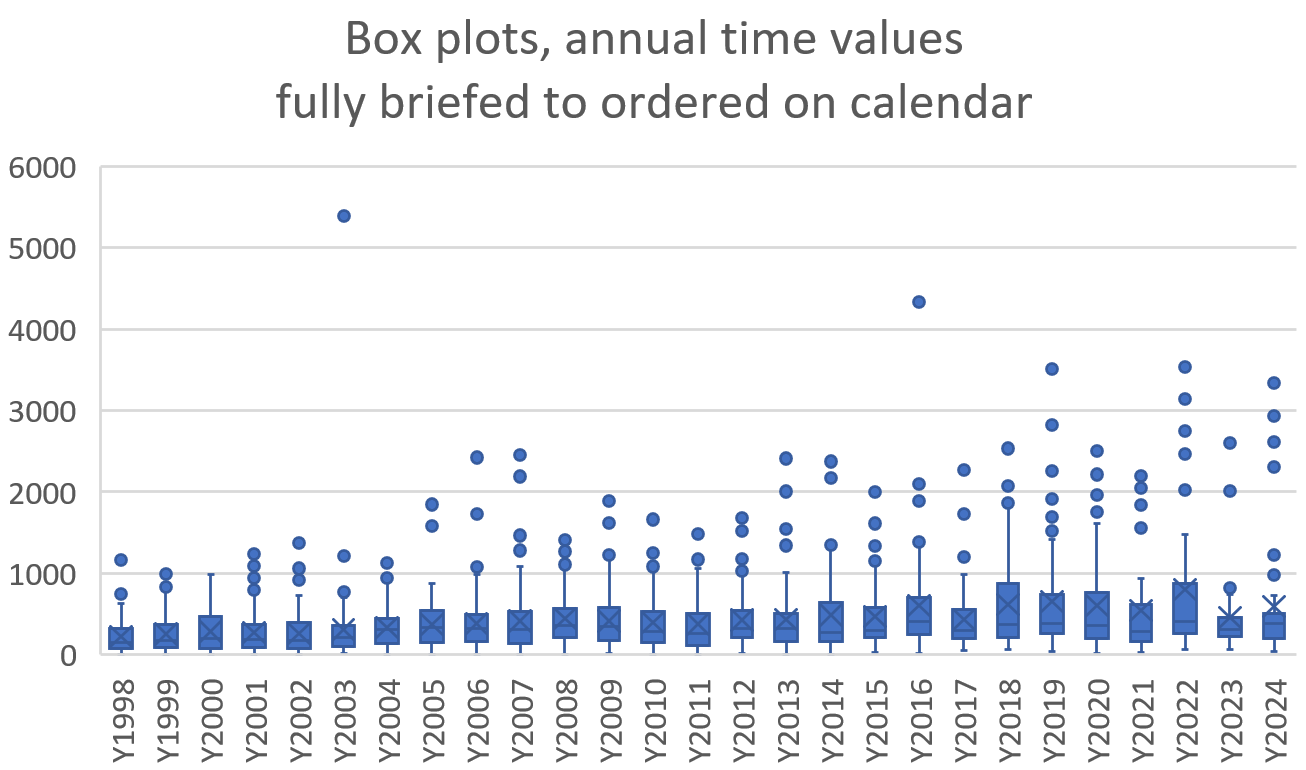
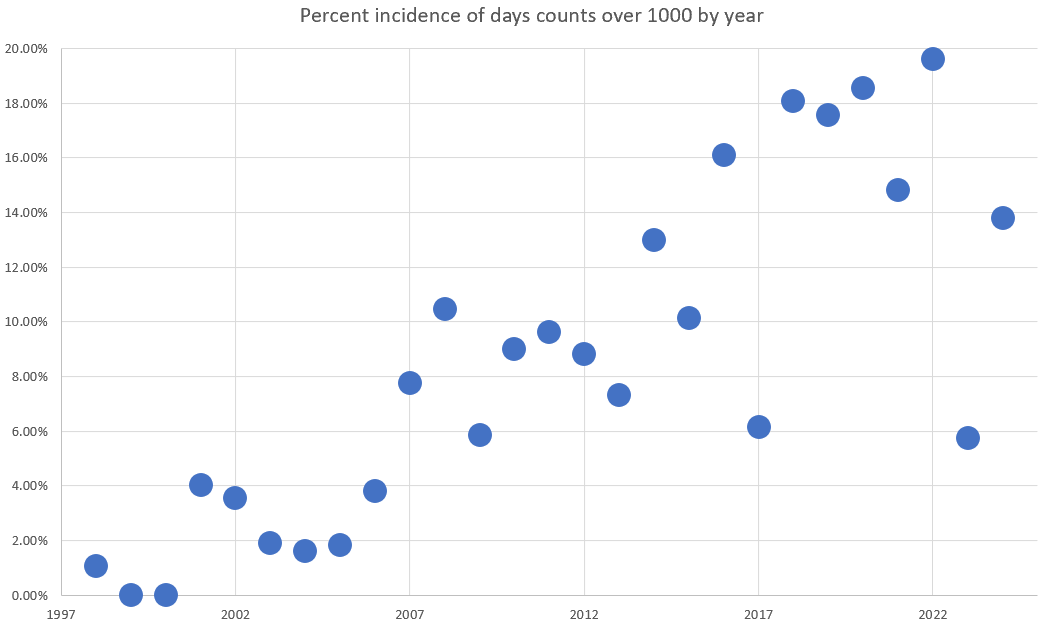
Figure 10 illustrates the increase in number, showing how often day counts over 1000 occur each year. Recall that Figure 5 shows that the per-year averages and medians for noncapital cases are all under 500, and that the overall average in Figure 8 is about 417 days — so looking only at case counts roughly double those values should isolate capital cases. As Figure 10 shows, the yearly percent incidence of decision times over 1000 days increases over time, from being quite rare to occurring in around 15–20% of the court’s cases each year recently.
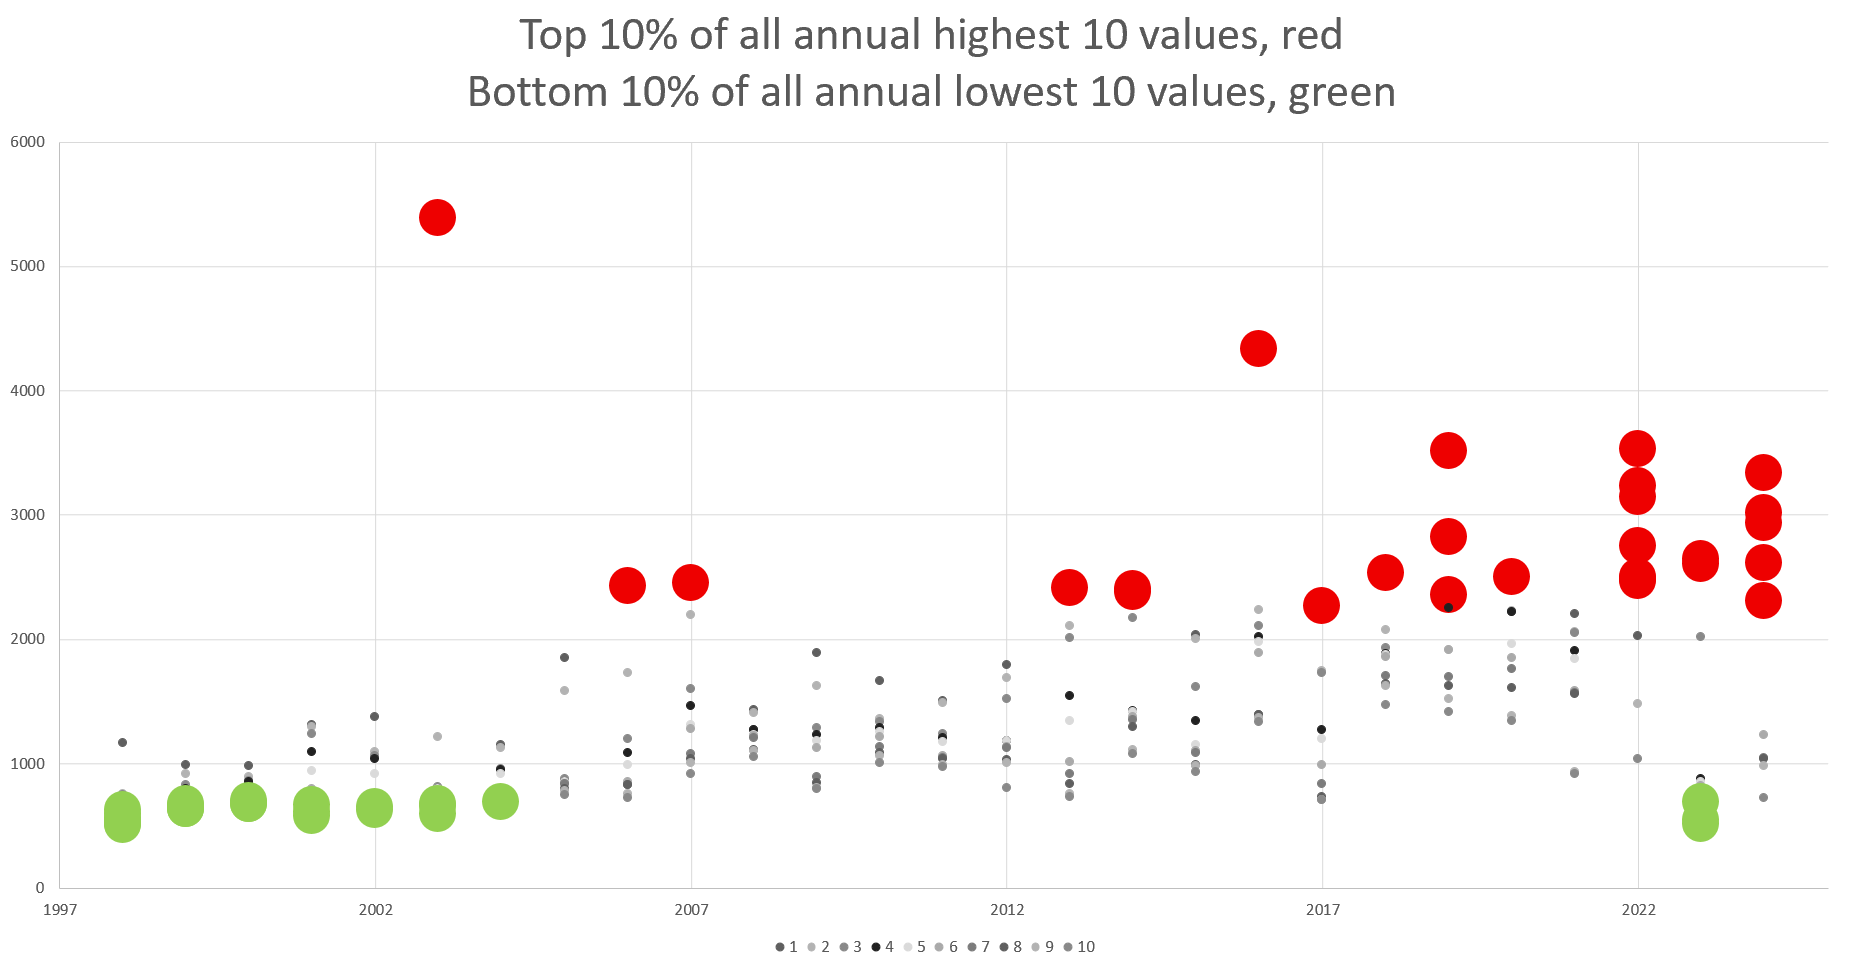
And Figure 11 illustrates the increase in magnitude by isolating the top 10 highest-ranked time values each year. Note that the top five values each year (marked red) trend up over time, showing that the longest decision times are getting longer.

Finally, Figure 12 highlights the whole study period’s top 10% highest values and bottom 10% lowest values. (There are 27 of each, and some markers overlap.) Note that nearly all top-10-highest values (red) cluster in the recent years, and nearly all the lowest values (green) cluster in the first seven years. Of the 27 largest values, 25 are in 2016 or after, so 92.59% of the longest-duration cases are since the procedural changes. Of the 27 smallest values, only three are in 2016 or after, so 88.89% of the shortest-duration cases are before the change.
The takeaway is that more of the court’s automatic appeals cases are taking longer to decide. That drives up the overall annual averages and medians, and with this we now know that those overall metrics are an unreliable basis for drawing conclusions about how long in general it takes the court to decide its cases. The values specific to automatic appeals skew those overall figures high, simultaneously misleading about how long any given case will take to decide and greatly underestimating how long a capital case will take to decide. Because opinion drafting time varies by case type a prediction about how long it will take the court to decide a given case that relies on overall figures likely is inaccurate. The upshot: the court’s longest-decision-time cases are steadily taking longer to decide, and the automatic appeals are to blame for this.
Case count: no, it’s not the capital cases causing the decrease in number
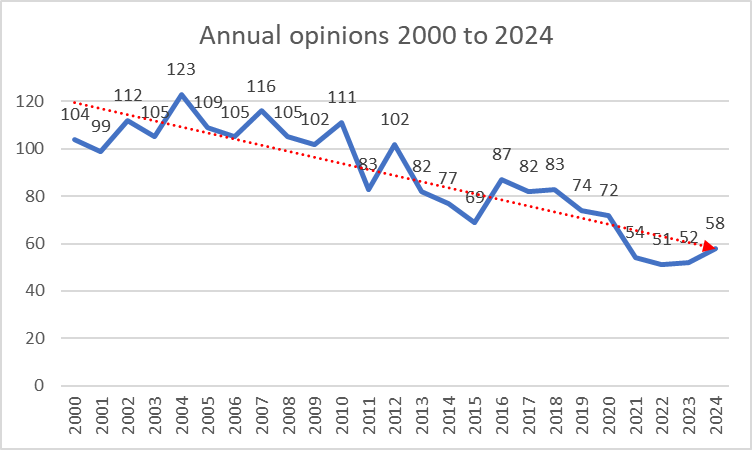
The court’s annual decision count decreases over time in the study period, as Figure 13 shows.
But separating out automatic appeals, as Figure 14 does, reveals that the noncapital case count falls at a greater rate than the automatic appeals. Automatic appeals declined from around 25 annually to single digits, while noncapital cases declined from a high of around 100 annually to 50-something per year. Regardless of the percent change in each category, the whole-number annual reduction in noncapital cases is about double that for automatic appeals. This means that noncapital cases are the primary factor in the falling total number of annual decisions.
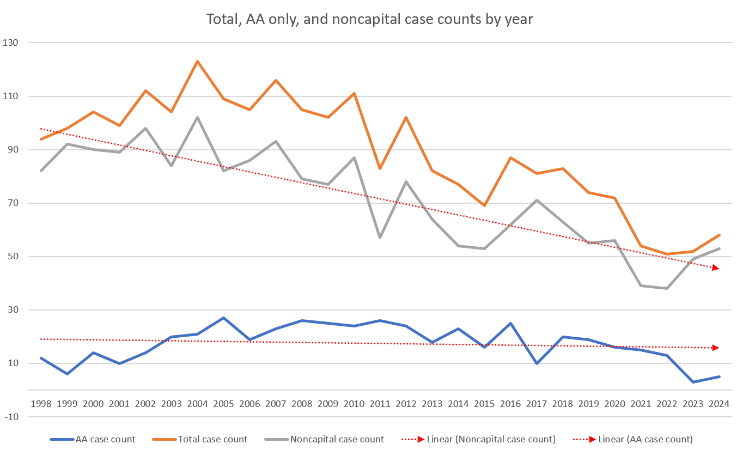
Note the trendlines for each category: the annual count of automatic appeals does decline somewhat but is rather flat over time, while by comparison the total and noncapital trendlines decline significantly. In Figure 14 the values and trendline for the total cases closely match the noncapital cases. And it’s only been in the most recent two years that capital case decisions have back-to-back single digit values. This suggests that changes in total cases are mainly driven by the noncapital docket.
We also examined changes in case-type proportions, and found that the noncapital cases are the bulk of the court’s annual decisions — even more so in recent years. Figure 15 shows that before the 2015–16 procedural changes automatic appeals were reliably 20–30% of the court’s annual decisions, and that the greatest change in that pattern is in the past two years. This is the only instance of capital cases constituting less than 10% of the court’s annual output since 1999.
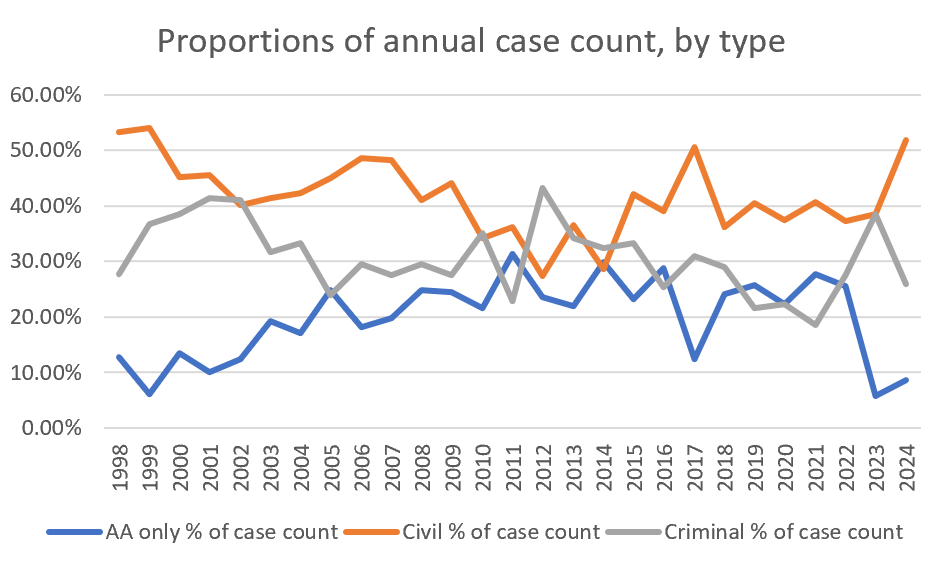
Note that since around 2022 the proportions of capital and noncapital cases change in opposite directions. Consistent with Figure 14, this shows that proportionally both capital cases are decreasing and noncapital cases are increasing. This means that any volume change in the noncapital docket will have a larger effect on annual decision totals than volume changes in the capital docket. From this we can conclude that although automatic appeals have some effect on the court’s declining annual decisions, the primary effect is the decrease in noncapital decisions. The one caveat is the substantial inflection in capital cases in the most recent two years. That recent inflection also affects the word count analysis, considered next.
Word count: no, it’s not the capital cases (recently)
Figure 16 shows that in general the total annual word count falls over time, which one would expect with fewer decisions each year. Yet the total annual averages and medians are rather flat over time, perhaps trending up slightly. This could indicate that annual decision counts and annual word counts track each other closely.

It’s also possible that annual decision totals are falling more than the annual word count (or conversely something is maintaining the annual word count at a higher level than the falling decision count), which would explain why the annual average and median word counts continue to hover around 10,000 words.
That seems to be the case. Capital case word counts are holding steady (Figure 17) while noncapital case word counts are increasing in length (Figure 18). This suggests that automatic appeals are not keeping the overall word count high — instead the noncapital cases are getting longer, particularly after the 2015–16 procedural changes.
Figure 17 shows that the automatic appeal average and median annual word counts are flat over the study period, both varying within a roughly 10,000-word band between 20,000 and 30,000 words.

By contrast, Figure 18 shows the noncapital average and median word counts rising over time, with a significant upward inflection starting around 2015–16.

And Figure 19 shows that the capital case proportion of the overall word count began to fall recently, beginning to change around 2015–16, with an even greater decrease in recent years. That’s consistent with the discussion above about the court deciding proportionally fewer automatic appeals, particularly in the most two recent years.

This all suggests that automatic appeals are not the primary factor in maintaining the average annual word count, and that instead we should focus on the increase in average noncapital case word counts.
To do so we parsed civil and criminal cases. Figures 20 and 21 show that civil decisions are longer than criminal decisions: by count, on average, and by medians. This suggests that civil cases are the primary factor in changes to the annual word count.
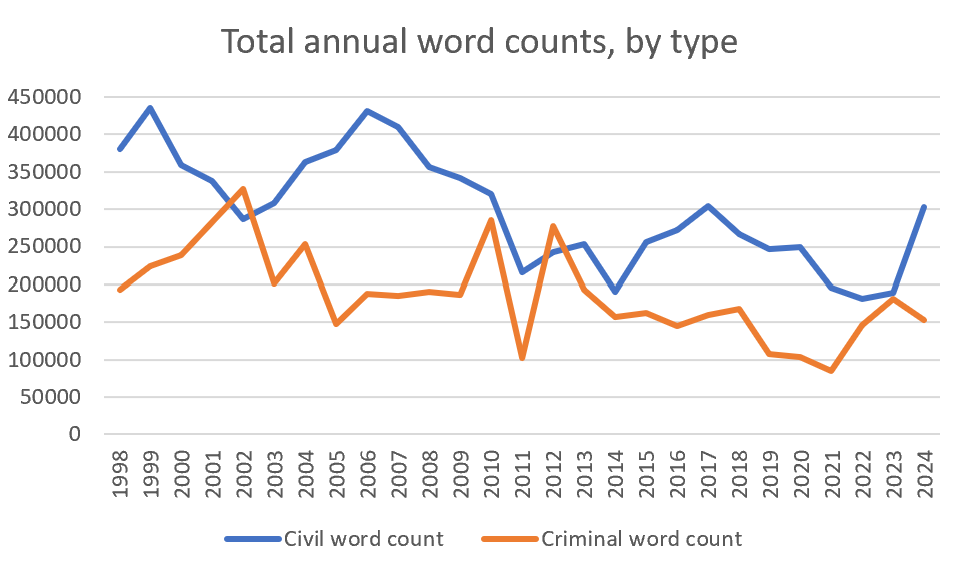
In Figure 21 the y-axis values are the same scale, allowing for direct comparison between the averages and medians. Note the absence of any great divergence between the two values, suggesting no major outliers skewing either calculation. The upward inflection around 2016 in average and median noncapital case word count suggests that these are the primary factor maintaining the total average and median annual word count against the falling number of capital cases.

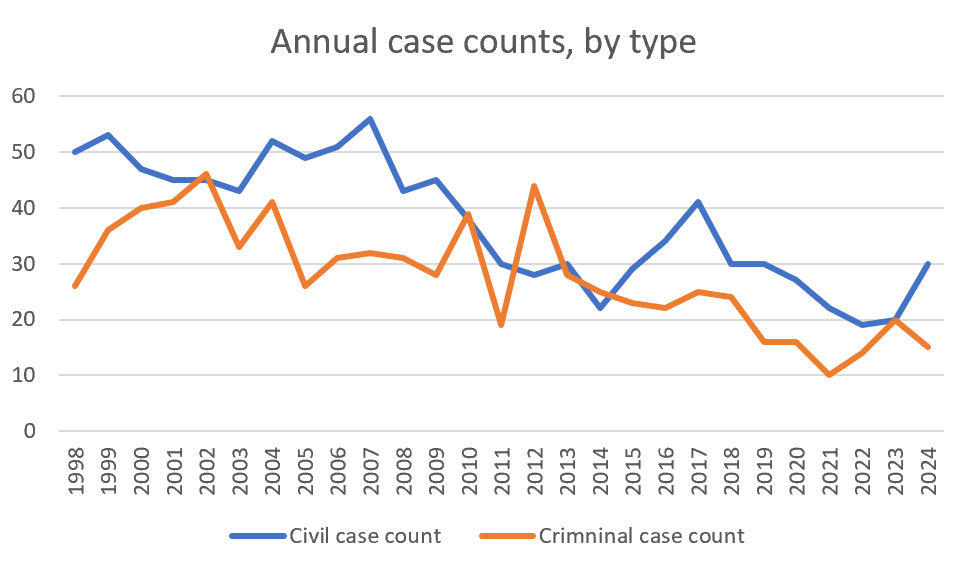
Within the noncapital cases, the civil cases are the greater contributor than criminal cases. Figures 20 and 21 show that civil cases have higher total, average, and median annual word counts. And Figure 22 shows that in general there are more civil than criminal cases every year. Considering the results from Figures 20–22, we can conclude that not only are civil decisions longer but also generally more numerous than criminal decisions. This suggests that between the two noncapital case types, civil cases are the greater contributor to the annual word count than criminal cases. But we found that the conclusion here differs depending on whether one views the whole study period or the most recent years.
To verify which case type is the overall greatest contributor to annual average decision word counts over the whole study period, we employed the following equation, where the contribution of case type-X to the overall average word count is equal to the product of the relative frequency of type-X cases and the average word count for type-X cases:
Average Word Count = (% of cases that are civil) x (average civil case word count) + (% of cases that are automatic appeal) x (average automatic appeal word count) + (% of cases that are criminal non-AA) x (average criminal non-AA word count)
Inserting the actual figures we get:
10,287.81 = (41.92%) x (8003.721) + (19.69%) x (24565.82) + (31.20%) x (6716.784)
10,287.18 = (civil 3355.16) + (capital 4837.01) + (criminal 2095.64)
This shows that for the whole study period capital cases are the overall greatest proportional contributor to the word count.[3] Consistent with this, Figure 23 displays the relative proportions for all three case types, which shows that capital cases are the largest proportion of the annual word count over the whole study period.
Yet change over time is a factor here, particularly given the recent significant changes in counts of case types, proportions of case types, and average word counts by case type. Civil decisions are the more significant factor in the overall average word count in recent years for several reasons: civil average word counts are increasing while capital decision average word counts are flat; there generally are more civil than noncapital criminal decisions each year; and in the past few years civil cases increased in volume while capital cases decreased in volume. Again, Figure 23 illustrates this change over time in the proportions of the annual word count that each case type contributes.
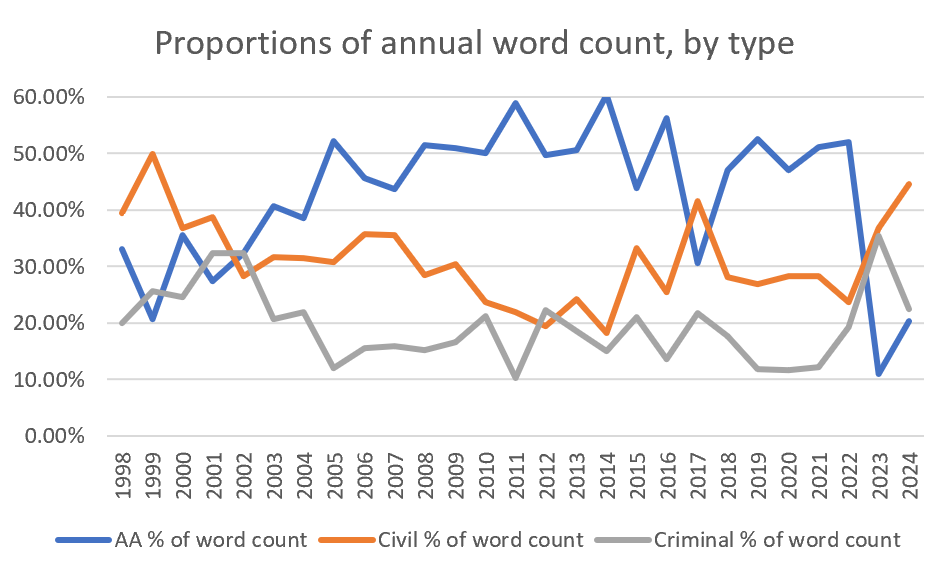
This data view shows that, although capital cases are the primary factor in the annual total word count for much of the study period, that is not true currently. Since 2022, capital and civil cases have inverted their relative proportions of the annual word count. The takeaway is that the noncapital cases currently maintain the overall annual word count. And given their higher volume and increasing word count, we conclude that the court’s civil cases are primarily responsible for maintaining the annual word count at a higher level now than would otherwise be the case from a falling decision count.
Do longer opinions take longer to write?
Finally, one might wonder if all that extra time spent drafting opinions explains why they are getting longer, and whether the increasing time and length combine to explain the decrease in annual decisions. We found conflicting evidence on this point. Figure 24 plots two variables: each decision’s word count and its decision time.

Favoring a strong correlation between those variables is that most of the court’s decisions in the study period cluster in a range of being decided within 1000 days and with a word count under perhaps 10,000 words. But in an xy plot like this a correlation is indicated by a clear diagonal pattern in the data: we expected the data points to fall into either an up-and-right line to show a positive correlation, or a down-and-right line to show a negative correlation. Neither pattern shows here, even along the trendline. It’s possible that breaking the decisions into subject matter types would produce a stronger pattern either way, but given this result we can’t conclude that there is a clear correlation between longer decision times and longer opinions.
We also explored any progression in word counts by justice, asking whether newer justices tended to write longer opinions than their predecessors.
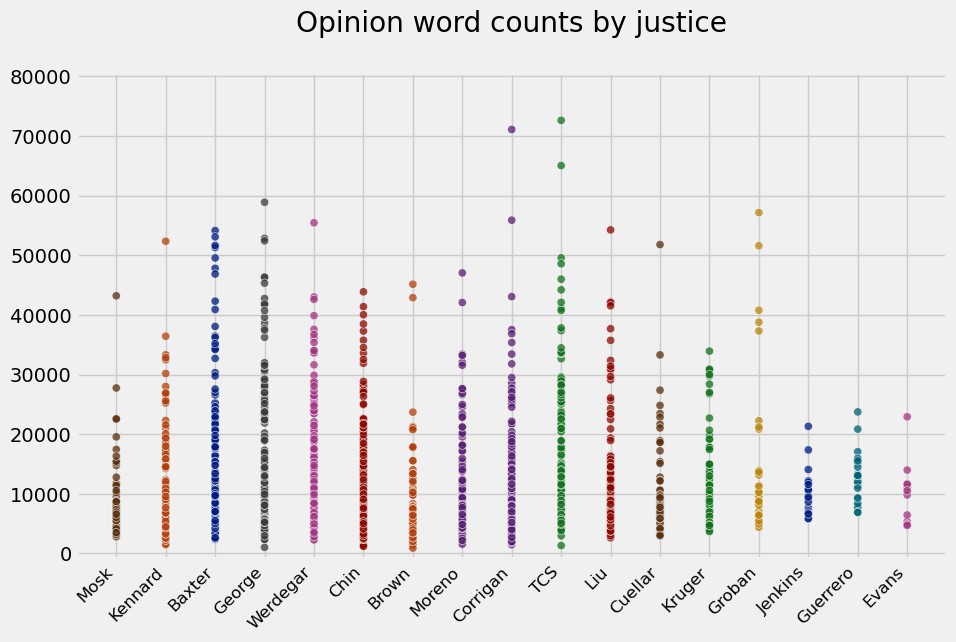
Not necessarily, as Figure 25 shows. We could of course dive deeper into individual justice comparisons, such as by calculating and comparing per-justice output, word counts, and opinion drafting times, but this suffices for now.
Conclusion
Our results conflict with the studies by other scholars discussed in our 2023 year-in-review article that found unanimous decisions tend to be shorter. California’s high court shows the opposite: as the court’s annual unanimity rate has increased in this study period, the overall annual average word count has remained rather static. But this is not supported by automatic appeals as one might assume. Instead, civil cases are in recent years the greater contributor to the increasing annual average word counts, with their high annual proportions of the total decisions, their generally longer length than criminal cases, and their clear trend of increasing length. In California, the contribution of case type to opinion length appears to outweigh the effect of unanimity.
This analysis shows that the common refrain but what about capital cases? is not the most pertinent question today. Capital cases are one effect here, but they are no longer the sole or even major effect on the performance metrics we evaluate. Rather, the recent decline in automatic appeals, and the recent trend changes in noncapital cases generally and in civil cases specifically, combine to demote capital cases to a lesser effect.
As always, an empirical study like this cannot address two key questions: why this is happening and what it means. For example, these results do not prove that unanimous opinions take longer to write. Nor does showing correlation between the inflection in the values considered here and the 2015–16 procedural changes prove causation. And this analysis is at best a data point in debates about whether California’s high court should be deciding more cases, deciding them faster, writing shorter opinions, or worrying less about achieving unanimity. All we can say with certainty is that some observable effects correlate strongly enough with particular factors that we can argue for causation in those contexts. All else is philosophy.
We close with some advice about keeping it short:
Clitus Barbour was onto something when he made the following remarks about the requirement of a statement of reasons: “We [do] not mean that they shall include the small cases, and impose on the country all this fine judicial literature, for the Lord knows we have got enough of that already. To give us the reason for it does not take three lines.”[4]
—o0o—
Senior research fellows Stephen M. Duvernay and Brandon V. Stracener contributed to this article. Research fellows Ben Pearce and Mason Seden-Hansen participated in the word-count and coding phase. With thanks to Bingyune Chen, CEO and managing partner at Active Digital for his assistance.
See the 2023 study for a longer explanation of these methodological factors. ↑
We excluded Legislature v. Padilla (2020) 9 Cal.5th 867, California Attorneys v. Newsom 2020 WL 2568388, People v. Daniels (2017) 3 Cal.5th 961, Burton v. Shelley 2003 WL 21962000, County of San Diego v. Ace Property & Casualty Ins. Co. (2005) 37 Cal.4th 406, and In re Attorney Discipline System (1998) 19 Cal.4th 582. ↑
Note that the actual overall average word count is 10975.58 — the capital, civil, and criminal subtotals exclude 173 habeas, questions, and original jurisdiction matters or 7.19% of the total. And we rounded at each step of the work above. ↑
People v. Kelly (2006) 40 Cal.4th 106, 126–127 (Corrigan, J., concurring and dissenting; citations omitted). ↑


